
Meeting sales targets and productivity goals has sales reps in a bind. To make the job easier, one of the first few tasks you may have undertaken is deploying technology. However, adding tools to the mix may not be the solution.
As more and more sales tools come into play, you increasingly rely on digital systems and an increasing amount of data.
You need actionable insights and predictive signals extracted from large amounts of data. This drives more value from analytics in real-time. It’s done using signals that suggest the next best action to move deals forward.
It can seem intimidating to find these insights without first understanding how to analyze sales data.
In this guide, we take a deep dive into how to analyze sales data and use it to maximize growth.

What Is Sales Data?
Before we move on to analyzing sales data, let’s get a clear understanding of the sales data definition.
Sales data is the information gathered by tracking your sales activities, from customer touchpoints to engagements.
Different types of sales data include:

What Is Sales Data Analysis?
Sales analysis evaluates the sales data and revenue generated over a specific period. It leverages technology and processes to analyze sales data and extract insights.
You can improve rep performance in the short and long term by analyzing sales data. Plus, you can identify, model and predict sales trends or outcomes.
Sales analysis is categorized into four types:
1. Descriptive
A descriptive sales analysis shows you what happened in the past or what’s happening in the present. It tracks historical data and compares it to current performance.
2. Diagnostic
Diagnostic analyses aim to find out the “why” behind sales performance data. It also tries to understand what actions caused a particular situation to occur.
3. Prescriptive
Prescriptive sales analysis determines how to solve a specific problem to improve performance. It first assesses the data and prescribes (or suggests) the next best action.
4. Predictive
As the name suggests, predictive sales analysis learns from past and current performance to gauge patterns. It then makes educated predictions of what will happen in the future. This gives you insights into building forecasts and setting optimum sales goals.
Why is it Important to Analyze Sales Data?
97% of sellers say that sales intelligence tools are “very important” or “important.” But why is it so important for you to analyze sales performance?
We found 8 reasons why:
1. To optimize future performance
Analyzing sales data equips you with the insights to build better revenue strategies. Using actionable insights, you can improve future performance.
Moreover, you can identify the actual sales figures to build accurate and reliable forecasts. As a bonus, your reps avoid chasing prospects with low intent.
2. To make informed decisions
As leaders, you make better decisions when you have information you can act upon. That’s what analyzing sales data does for you.
It shows you the areas of improvement. Not only that, it also helps you figure out which channels work best, which ones you can double down on and what locations or industries you should serve.
Say you’re focusing on LinkedIn, but most of your leads come from email marketing. Using sales analysis, you can prioritize successful channels.
3. To understand the market
The reports from sales analytics give specific insights into demand for your product(s). If there’s an increase or decline, you’ll know it. But that’s not all. Analytics also helps you round up the possibilities for demand changes.
For instance, a decline could mean that your competitor offers a better product or better features.
With market insights, you can determine when it’s time to find a new target market, improve your features or add more. You also get an assessment of market prices and the value of your product(s).
4. To drive better use cases
Customers may use your tool for specific needs, or there may be features they prefer. Insights from analyzing sales data can drive better use cases for other buyers.
When customers get a unique perspective and solution for their problem, they’re more likely to stick around.
5. To personalize the sales process
Analytics evaluates your
- Historical sales data
- Patterns in closed-won and closed-loss deals
- Buyer needs
- Industry data
It gives you a distinct peek into the buyer committee, defining individual stakeholder roles. Which means you get to personalize interactions suited to their needs. Buyers will more likely consider your business if reps engage in research.
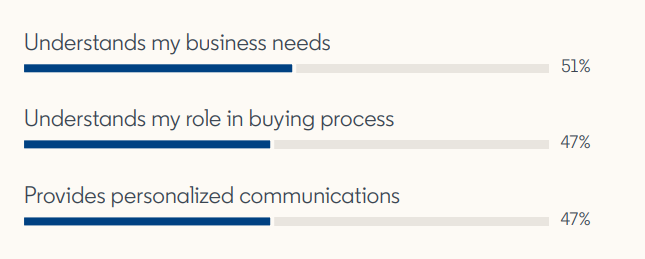
What buyers are looking for in sales interactions (Source: LinkedIn, 2022)
6. To drive productivity
Find out which sales motions lead to more wins using analytics. Following this, you can double down on these motions and replicate them for all reps. Plus, you get rich insights and data-driven feedback for qualitative coaching.
With these workflows in place, reps can focus on what matters most – personalized selling and winning more deals.
7. To improve cash flow
Sales is one of the primary sources of cash flow. Analyzing it gives you a better understanding of your current cash position. You can take steps to refine your sales process in a way that benefits cash flow and your business.
8. To get on the growth track
Change the path of your business by getting on the growth track with sales analytics. Use it to improve sales processes and, subsequently, revenue.
With an improved cash flow, win rate, retention rate, productivity and forecasts, sales analytics can back you up for funding opportunities.
The better the health of your business, the better your chances for acquiring investment.
How To Analyze Sales Data?
The following steps show how you can analyze sales data systematically.
Step 1: Identify the sales data to collect
You can identify what sales data points to collect using metrics. Below are some key metrics to watch out for:

1. Sales revenue
It shows the total revenue you’ve earned from sales over a specific period. Use sales revenue to determine if you’re in a healthy growth situation, if you’ve hit business goals or if you’re setting realistic ones.
2. Sales growth
Sales growth tracks the increase or decrease in sales revenue during a specified period. It provides a general overview of your sales performance and profitability.
Determine if your business is growing or stagnating. Use it to set up strategies for positive growth.
3. Conversion rate
Conversion rate shows the general effectiveness of your sales process. While monitoring this metric, consider conversion opportunities at each sales funnel stage, too.
You can also compare it with customer acquisition cost (CAC) to determine profitability. If your CAC is high and the conversion rate is low, your bottom line suffers.
4. Win rate
Win rate compares deals closed with viable deals in the sales pipeline.
Conversion rate impacts your win rate. If you have a low win rate, your sales process warrants further improvement.
In case of a high or favorable win rate, use sales analytics to learn what’s working and replicate it for continued success.
5. Sales per rep
Sales per rep tracks individual rep performance for a specific period. It looks at the number of deals closed plus the monetary value of each deal.
Use this metric to determine:
- Who can you assign to higher-value deals
- Who needs ongoing professional development
- Who should get a promotion
- Reward and bonus distribution
6. Time to close
Time to close shows the time it takes to nurture a lead from first contact to conversion. In short, it tracks the time between opening and closing an opportunity.
Monitor your sales reps’ performance, customer behavior, and underperforming strategies with this KPI.
7. Average deal size
Get average deal size by dividing the total revenue generated during a specific period with the total number of closed-won opportunities.
It’s typically used for sales forecasts to estimate how many deals reps must close to attain their quota.
For an extended list of metrics to track, check out this resource.
Step 2: Choose a method to analyze sales data
Next, select a method that fits with your business goals and the metrics you’re tracking.
You can choose from these:

1. Sales performance analysis
This method evaluates your team’s performance. It also assesses the overall effectiveness of your sales strategy.
Sales performance analysis tracks the sales per rep. It then generates financial assessments based on revenue. You can also compare expected outcomes with actual sales results. Plus, it comes in handy to adjust and upgrade sales performance.
Use sales performance analysis if you want to:
- Achieve higher win rates
- Shorten the sales cycles
- Boost revenue
- Increase profit margins
2. Sales trend analysis
Sales trend analysis focuses on trends over a specific period to find patterns. A micro trend lasts for up to a week (or seven days). Macro trends could last for up to a quarter.
It’s used to determine if your sales figures have an upward, downward, steady or fluctuating trend over time.
You can deploy trend analysis not just for monitoring overall sales but also for –
- Specific products
- Product ranges
- Customer segments
- Channels
- Locations
- Sales teams
- Individual rep performance
Use sales trend analysis if you want to:
- Determine the progress toward sales goals
- Increase or decline in rep performance
- Increase or decrease in product demand
- Arrive at your win-loss ratio
- Understand evolving customer preferences and markets
3. Sales pipeline analysis
It takes a look at all the activities a prospect undertakes during the sales pipeline (which is a visual representation of the buyer journey) as they either convert or abandon the deal.
Sales pipeline analysis determines your pipeline velocity, i.e., how fast leads move through the pipeline. Simultaneously, it also accounts for average deal value, number of deals closed and drop-offs.
Closed deals show how many prospects went from lead to cash (conversion) in each pipeline stage. On the other hand, drop-offs show you how many prospects left the pipeline without conversion. You can also identify the reasons behind deal failure.
Use sales pipeline analysis if you want to:
- Get qualified prospects in the pipeline
- Attract high-intent leads
- Quicken the sales cycle
- Improve buyer-seller interactions
- Win more deals
4. Sales team analysis
You can deploy sales team analysis if you have multiple sales teams or departments within sales. Take the case of business development and account management–two departments within a sales team.
This method does a granular analysis of each rep’s sales effectiveness. It dives into data like win rate, average deal size, sales pipeline velocity, number of demos scheduled, churn rate and employee satisfaction scores for each rep and each team.
Use sales team analysis if you want to:
- Improve rep performance and productivity
- Chart out focus areas for coaching
5. Product sales analysis
It assesses the effectiveness of particular products. This analysis also gives a breakdown of revenue, profits and expenses for each product.
It benefits you if your company has a range of products with multiple features or variants. You can identify top-selling items as well as underperformers. And you can see how they impact your bottom line.
Use product sales analysis if you want to:
- Understand which products and features interest customers
- Leverage these to improve the bottom line
6. Customer sales analysis
It evaluates your buyer using a breakdown of sales, revenue and profits for each audience segment. Some factors used for the analysis include demographics, interests, channels, funnel stage and firmographics.
For instance, those in California (US) may prefer Product A. On the other hand, customers in British Columbia (CA) may want to combine features from Products A and B.
Use the customer sales analysis if you want to:
- Find out everything about your customer
- Create an accurate ideal customer profile (ICP)
- Personalize deals for each segment
- Understand the response to marketing and sales efforts
- Determine which campaigns and communication channels work better
Step 3: Optimize the data collection process
Cleaning and organizing your data should be an ongoing process. But if you don’t have accurate data, now’s the time to prepare it for analysis. It’s important only to use high-quality and clean data for reliable insights.
There are multiple sources from which you can collect data:

1. Sales tools
Customer transaction and purchase history on the CRM, sales enablement platforms, conversational intelligence tools and more.
2. Website
Visitor’s actions, time spent on the website, bounce rate, and the like.
3. Campaigns
Marketing and sales campaigns that help learn about customer preferences and segments and how you can address their needs.
4. Surveys
Customer surveys, employee surveys, vendor surveys, reviews, online polls and feedback forms.
5. Market Intelligence
Reports on prospects, customers, vendors and competitors. You can source these from DaaS providers with paywalls or financial and market intelligence platforms.
6. Social media
Social media insights on the target audience’s behaviors, demographics, interests and preferences.
7. Chatbots
Website or social media chatbots that interact with customers and understand their queries, pain points, features or products most interested in.
Step 4: Use tools to analyze sales data
You could set up custom analysis templates in Microsoft Excel or Google Sheets. But this needs significant manual effort.
Instead, go for advanced and faster analysis using tools designed for sales analytics. Today, several tools use AI to automate the analysis process, provide more accurate results and build visualizations.
Related Resource: Top Sales Activity Tracking Tools
Step 5: Prepare the sales analysis report
The sales analysis report is a summary of all activities in one document. It provides details on sales volumes, leads, new accounts, revenue, marketing and sales expenditure, and profit.
It also shares a holistic view of the sales process, methods (including what worked and what didn’t), forecasts and customer insights.
Every sales analysis report must cover a few topics:
1. Audience information or snapshot
2. Previous and current sales trends
3. A compilation of sales data (based on the metrics you use)
4. A presentation of the analysis (depending on the type of analysis used). It may include data visualization and explanation.
5. A collection of key insights which include:
- Comparison of your overall performance with macro trends
- Impact of demographics and firmographics on the sales process
- Best-selling products and features
- Active contact and account data
- Relationship intelligence around the buying committee
- Accounts most likely to expand or churn
- Activity intelligence for every deal, including pipeline health, opportunity scores, upsells, and cross-sells
- Opportunities nearing closure and how to win them faster
- Rep performance and improvement strategies
- Successful sales motions of top reps and how to replicate them with guidance and coaching
How to Analyze Sales Data: A Checklist
- Step 1: Identify sales data to collect
- Step 2: Choose a sales analysis method
- Step 3: Optimize the data collection process
- Step 4: Use tools to analyze sales data
- Step 5: Prepare the sales analysis report

Use AI for Sales Analysis
There’s no time like now to implement sales analytics in your team and organization. And if you already have an existing infrastructure, it’s best to upgrade to maximize growth.
Use Nektar’s revenue intelligence for unified account and activity data to back reps while growing your sales.
Get in-depth and clean reports on the below, in a single dashboard:
- Sales performance
- Rep performance
- Sales activities, and
- Buyer insights
Find out more about how to analyze sales data using Nektar. Take a product tour or talk to us one-on-one.