If you have set up a revenue operations function in your organization and wondering what KPIs to track, this guide is for you.
Tracking the right revenue operations KPIs can have a massive impact on your revenue. Setting up KPIs plays a crucial role in improving workflows.
Not just that, but they also provide you with the means to create an unforgettable customer experience.
So, how can you maximize RevOps KPIs for profitability? And more importantly, which ones should you measure?
In this blog, we’ll dive into revenue operations KPIs with insights from our conversation with Cliff Simon, CRO at Carabiner Group.
You can listen to the full conversation here:
Revenue Operations KPIs and Their Role in Cross-Functional Alignment
Before we move on to KPIs, let’s get the basics right. That starts with understanding what RevOps is precisely.
Cliff says it’s about following the dollar’s value through the revenue funnel.
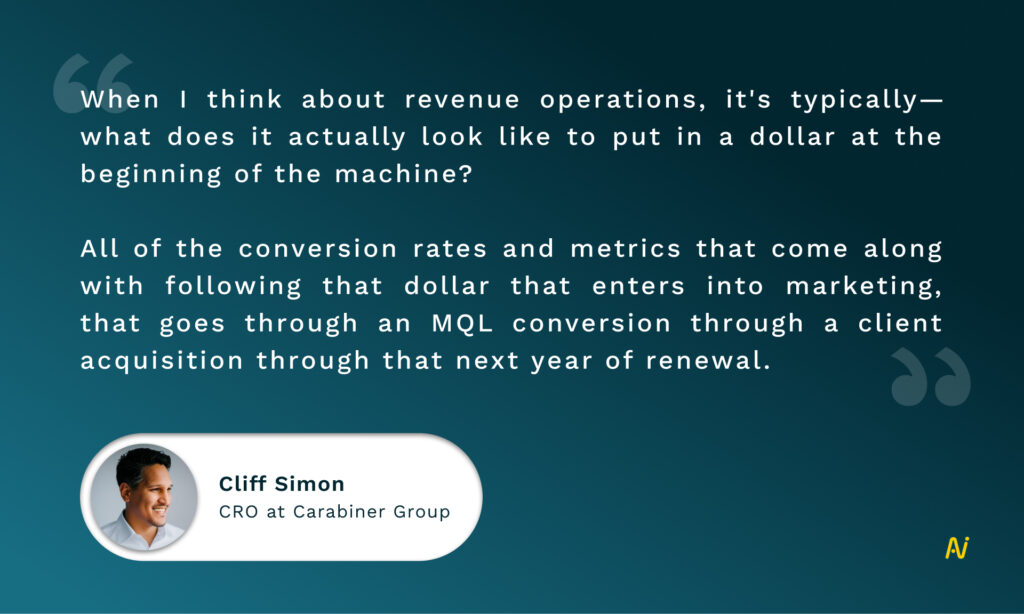
Notice how he doesn’t mention sales explicitly? That’s because RevOps is a much larger process than sales operations. It doesn’t just cover the sales touchpoint but tracks the entire customer journey.

What’s important to note is that alignment between teams is the key driving force behind RevOps. Sadly, cross-functional misalignment is also a big pain point for SaaS businesses.
This misalignment leads to a lack of communication between teams, manifesting siloed data.
Companies have tons of data, but it sits in separate data lakes. These lakes don’t have any connecting bridges and don’t come together into a unified source. Because the lakes are separated, organizations have no idea about meaningfully using insights from siloed data.
That’s the reason why achieving alignment is the first step. And from there, it’s about maintaining this alignment between teams as you scale.
But how do you track alignment and revenue growth as a result of it? Using revenue operations KPIs.
Why Should You Measure Revenue Operations KPIs?
Companies can only improve or innovate if they know where they’re going wrong. RevOps KPIs help you track your customers’ progress and team performance throughout the buyer journey. This includes all revenue-generating teams—marketing, sales, customer success, product, finance, and more.
These KPIs are particularly important today when aligning workflows between multiple teams is a complex process.
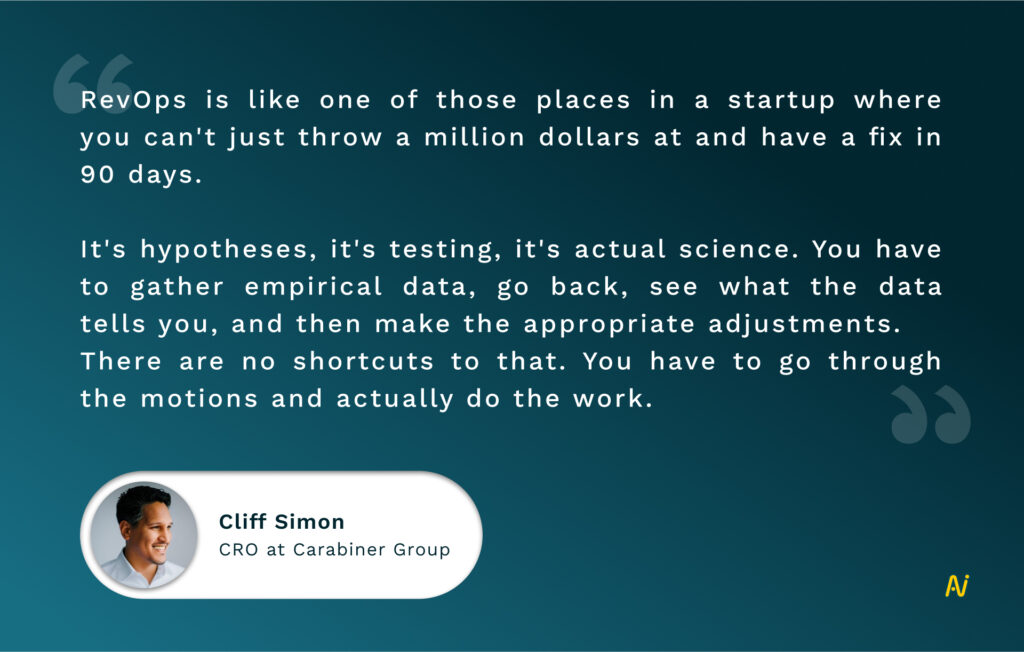
Revenue operations KPIs measure the progress of shared workflows to determine if they’re catering to customer needs. They also measure performance at each customer touchpoint. You can go granular with KPIs to improve efficiency, eliminate friction and maximize revenue for growth.
From an overarching perspective, revenue operations KPIs are your strategic guide to achieving business goals through revenue operations.
Let’s move to the next most important question—what RevOps KPIs should you be tracking?
10 Essential Revenue Operations KPIs You Must Measure
If you’re new to the RevOps journey and are just beginning to pay attention to KPIs, this list will help you pinpoint the correct revenue operations KPIs to measure.
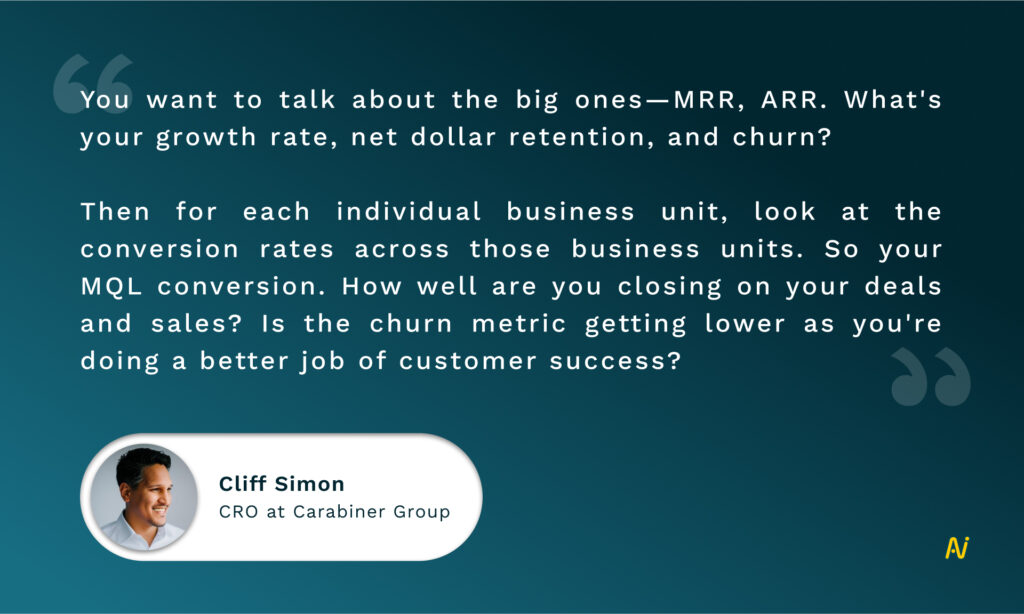
The remaining KPIs can be added as you scale your business. So, let’s dive in.
1. Revenue
This is a no-brainer KPI, to begin with, but it’s also obviously critical.
Revenue is the amount generated by your business.
Measuring this KPI helps you figure out:
- If you have a consistent revenue stream over a given period
- What are the ups and downs
- How to adapt your pricing
- What’s your progress against business goals
Typically, you must look at recurring revenue—subscriptions, membership fees, and license fees— in terms of Monthly Recurring Revenue (MRR) and Annual Recurring Revenue (ARR).
As the name suggests, MRR gives you a monthly overview. The formula for MRR is:

ARR, an annual KPI, can be used for more important business goals, measuring growth, and sales forecasting. There are two ways to calculate ARR, which you can see below:

2. Sales Pipeline Velocity
Sales pipeline velocity measures the time a customer takes to move through the pipeline from lead to conversion. However, it’s stated in terms of revenue, not time.
While sales pipeline velocity can differ widely from company to company, a usual B2B sales cycle could take as much as a year.

It can be used to determine how much time your reps take to convert a lead. And if you should introduce any changes in the sales workflow.
A higher velocity signifies that your sales process is organized and structured. This solid process pushes leads through the revenue funnel via frictionless handoffs. MQLs quickly become SQLs which, in turn, become closed or won opportunities.
However, if your velocity is low, your revenue process may have bottlenecks that must be removed. You must identify these bumps and eliminate them to sustain growth.
3. Customer Acquisition Cost (CAC)
You have to spend a certain amount of money to get new customers over a given period. For instance, money spent on running digital ad campaigns is a cost to acquire new customers.
That’s CAC for you.
Other costs associated with converting leads to revenue could fall under:
- Advertising
- Sales hiring
- Commission
- Sales rep coaching
- Overheads, and more.
CAC is calculated as below.

CAC measures your ROI on the investment made to acquire customers. It determines if you’re getting your money’s worth through new customers to improve profitability.
This revenue operations KPI also reflects your marketing and sales success. It shows if you’re on the right track with your campaigns, messaging, and communication.
If your ROI is low, you can strategize on reducing your CAC without affecting the quality of buyer-seller interactions for your company.
4. Conversion Rate
Conversion rate (sometimes known as “win rate” or “opportunities to close ratio” in SaaS) is the number of opportunities that you turn into closed deals. It shows the percentage of leads that moved through your revenue funnel and became customers.

If your conversion rate is low, you’re not doing something right in the revenue process. This revenue operations KPI provides a big-picture overview of why you couldn’t close more deals.
Then, you can dive into questions such as:
- Does marketing need to provide the sales team with high-intent MQLs?
- Are you more focused on the volume of MQLs and SQLs, rather than their quality?
- Do reps need more coaching to work with multiple stakeholders?
- Or does your team need more content resources to engage with buyers?
If you want to pinpoint where the revenue process goes wrong, you could also go granular and consider conversions at various stages. For instance, you could track website visitors who signed up as leads or the number of free trial customers who became paying customers.
Once you’ve found where the problems exist, you can take corrective measures to streamline workflows.
5. Average Contract Value (ACV)
Average contract value measures the total amount of revenue earned from a contract for a given period (generally, one year). It’s also an annual average of the total contract value or TCV.
As you can infer from above, ACV is used when you have annual or multi-year contracts.

It’s best to look at ACV in conjunction with other revenue operations KPIs like CAC, ARR, and TCV to measure your progress against business goals.
For instance, ACV shows you the potential revenue from a contract, while CAC shows how much you spent to close that contract. Compare ACV with CAC to determine how much time you need to make a profit from the contract.
This revenue operations KPI can also be a leading indicator for coaching and rep development. You can improve your reps’ abilities to close contracts with higher ACVs.
Another way to use ACV is to identify which reps are best suited to particular accounts. You may have one contract with a high ACV, which needs special attention from an experienced rep. Tracking ACV will give you a better idea of which rep you should assign to the customer.
Similarly, average contract value identifies opportunities for upselling and retention. You’ll know which contracts can bring in more revenue and, therefore, upsell more to that particular customer, reduce their chances of churn, and improve their LTV.
6. Revenue Retention
If you want to scale with sustainable growth, don’t focus on bringing in new customers alone but on retaining existing ones.
Revenue retention KPIs show you how satisfied customers are with your product or solution.
If revenue retention rates are low, it’s time to make improvements and switch up your customer success tactics.
You must track two key revenue retention KPIs: Gross Revenue Retention (GRR) and Net Revenue Retention (NRR).
GRR is the percentage of recurring revenue you retain each month after accounting for cancellations and downgrades. Also, it doesn’t include expansions (upsells and upgrades).

NRR, on the other hand, measures your ability to retain and expand your revenue.

7. Customer Churn
Churn is a critical part of revenue performance and that’s amply visible from the KPIs we’ve listed above. It’s an absolute must to track churn.
But what’s churn exactly?
It’s the customers who stop paying for your solution or product within a particular period. And it’s calculated as below.

Churn rates vary from industry to industry and even for each business, but they hover around 4.91% for B2B and 6.77% for B2C on average.
If your churn rate is higher than these numbers, you may be doing an excellent job of onboarding customers, but the job of retaining them? Not great.
Churn lets you figure out how to convince customers to stick with you. We stress “convincing” customers because if they don’t believe in you (including your team or product) in the long run, they will eventually turn to better alternatives.
The higher your churn, the more problems you have. And that starts with acquiring new customers because they may cancel before you even see the ROI on their contract.
You can also look at improving customer success processes, onboarding, and implementation to improve your churn.
8. Renewals and Expansion
Renewals and expansions (upsells, cross-sells, and upgrades) are equally, if not more, important as acquiring new customers. In the current economic environment, buyers are looking at reducing expenses and deriving more value for their money.
Plus, it’s common knowledge that acquiring a new customer costs more than retention.
There’s a 60% to 70% chance of an existing customer buying from you, compared to a measly 5% to 20% chance of closing a new sale.
One of the essential measures here is the renewal rate.

This revenue operations KPI motivates you to keep customers around for a longer time, gradually increasing your revenue from them.
Because RevOps tracks customers throughout their time with the business, you’re uniquely placed to improve retention and provide more value across the buyer journey.
If your retention rate is high, you can also optimize CAC and improve your ROI as customers spend more time and money with you.
9. Customer Lifetime Value (CLTV)
Customer lifetime value is the total monetary value of a customer during the entire period of your business relationship.
CLTV lets you make the most of every customer relationship compared to constantly acquiring new customers (which, as mentioned before, is a more expensive affair).
The longer a customer stays with you, the higher their value and the higher your revenue over time.
Here’s the formula for LTV:

This revenue operations KPI gives you insights into renewals, upsells, and cross-sells opportunities. As such, it efficiently drives growth by reducing your CAC and churn and improving profitability.
LTV is one KPI that the customer success team can directly influence, as it’s linked to their activities.
It also helps your marketing and sales teams strategically modify the ICP so you can direct your resources toward the right customers for your business.
10. Time To Value (TTV)
Time to value, or TTV, measures the time it takes for a new customer to derive value from your solution. Value here represents “value for the customer.” It could be revenue, productivity boost, or something else (depending on their objectives).
Most businesses tend to ignore TTV and instead focus heavily on retention, renewals, and expansion. But if you measure this revenue operations KPI correctly and in a timeline manner, TTV can complement all of the above revenue operations KPIs.
The quicker customers get value from your product, the better it is for your revenue.
Use the TTV KPI to retain customers by delivering value on time. This is particularly important in SaaS, where customers want to derive value from solutions quickly. Delay in value is a powerful deterrent to retention.
TTV helps you give customers ROI faster, increasing the likelihood of them sticking with you. It also improves your reputation, giving you a solid competitive edge.
You can measure time to value through:
- Time taken for onboarding
- Time taken to achieve first value
- Time taken to upgrade from free to paid
- Time for the adoption of new features or upgrades
- Time to achieve desired ROI (for the customer)
- Customer feedback
BONUS METRIC
ANOTHER MUST-HAVE METRIC TO TRACK according to Cliff is tracking your operating cadence.
Operating cadence looks at everyday tasks or recurring operational activities. It then maps milestones for team alignment based on these activities. Teams then check up on each other’s performance against company objectives.
Operating cadence meetings allow each team to report progress and request help wherever needed. It also aligns resources for solving problems or removing obstacles.
It creates team alignment by pushing RevOps to drive full-funnel accountability and operational uniformity.
At the same time, as they check up on each other’s progress, revenue teams maintain autonomous processes. Therefore, regular updates and staying in rhythm with each other are essential.
Tracking the operating cadence is difficult and nebulous, but extremely critical. This requires you to regularly meet with the various business departments to make sure information is being shared. RevOps leaders must create a system to enable this free flow of information that also ensures everyone in the business is speaking the same language.
RevOps expert Jeff Ignacio describes this in detail. Read the details here.
Or tune in to the full episode of our conversation with Jeff below.
Move Away From Vanity Metrics

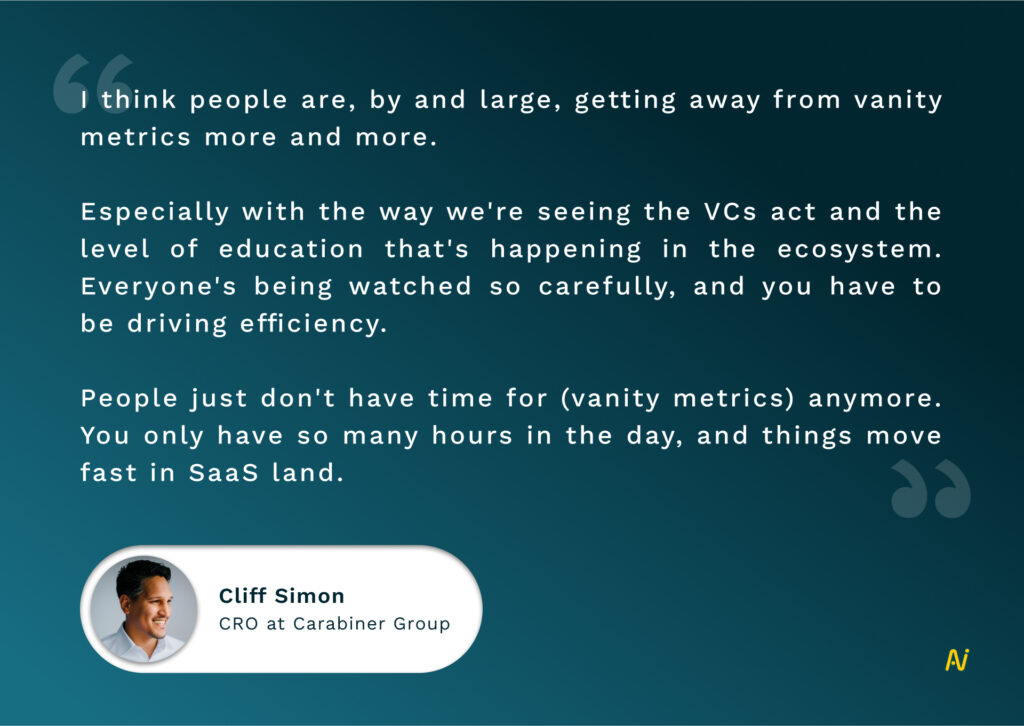
At a time when providing value for buyers is so important, it’s easy to get lost within vanity metrics. These KPIs may seem important at the surface level but don’t tie back to revenue growth.
They serve as social proof without providing any meaningful information on your progress.
Some of the vanity revenue operations KPIs you must avoid are:
a. MQLs
b. Opportunities created
c. Open rates for email campaigns
d. Organic website traffic, page views, bounce rate
e. Impressions, reach, and engagement on social posts
However, SaaS businesses are now realizing the difference between essential and vanity KPIs, which will drive revenue growth in the long run.
Stay on the Growth Track with Revenue Operations KPIs
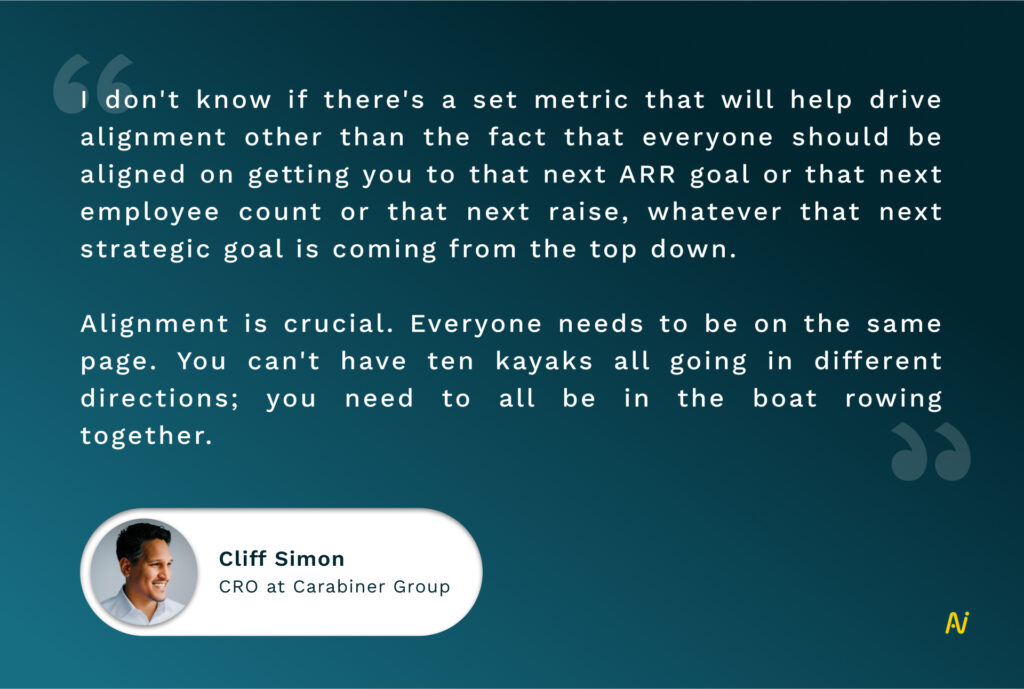
While there’s no defined metric to measure alignment, RevOps aims to achieve and maintain cross-functional collaboration through shared goals and a common data governance framework. You can measure the above KPIs with greater clarity across the revenue funnel by streamlining your operations.
Now that you know what revenue operations KPIs you must track (and the ones you need to stop glorifying), it’s time to put this learning into action.
To measure these KPIs correctly and ensure alignment, the first step is to build a robust RevOps framework. You can use this extensive guide as a starting point.
To learn more about revenue operations, subscribe to our podcast. Or get in touch with our team to put your roadmap into action.

