





Unlocking Revenue Intelligence: Bridging Data Gaps with AI & GTM Strategies

Unlocking Revenue Intelligence: Bridging Data Gaps with AI & GTM Strategies

A conversation with Uday Sharma.

Executive Summary

Data trust is not a reporting problem. It’s an operating system problem. In this episode, Uday Sharma (Head of GTM Analytics, RevOps at Postman) breaks down why most revenue issues don’t start in dashboards. They start in fragmented systems, shifting definitions, and human behavior.

From preparing Cloudflare’s IPO metrics to building internal revenue intelligence platforms used by hundreds of sellers, Uday shares what it actually takes to build a true “revenue truth layer” that can support forecasting, experimentation, and AI.

Readers will learn:

  • Clean dashboards don’t equal clean revenue: if entity mapping, definitions, and snapshots are broken, forecasts are fiction.
  • Everything should be measured, but few metrics should be monitored: signal filtering is a leadership discipline.
  • Snapshots are non-negotiable: without historical state tracking, you cannot debug forecasting misses.
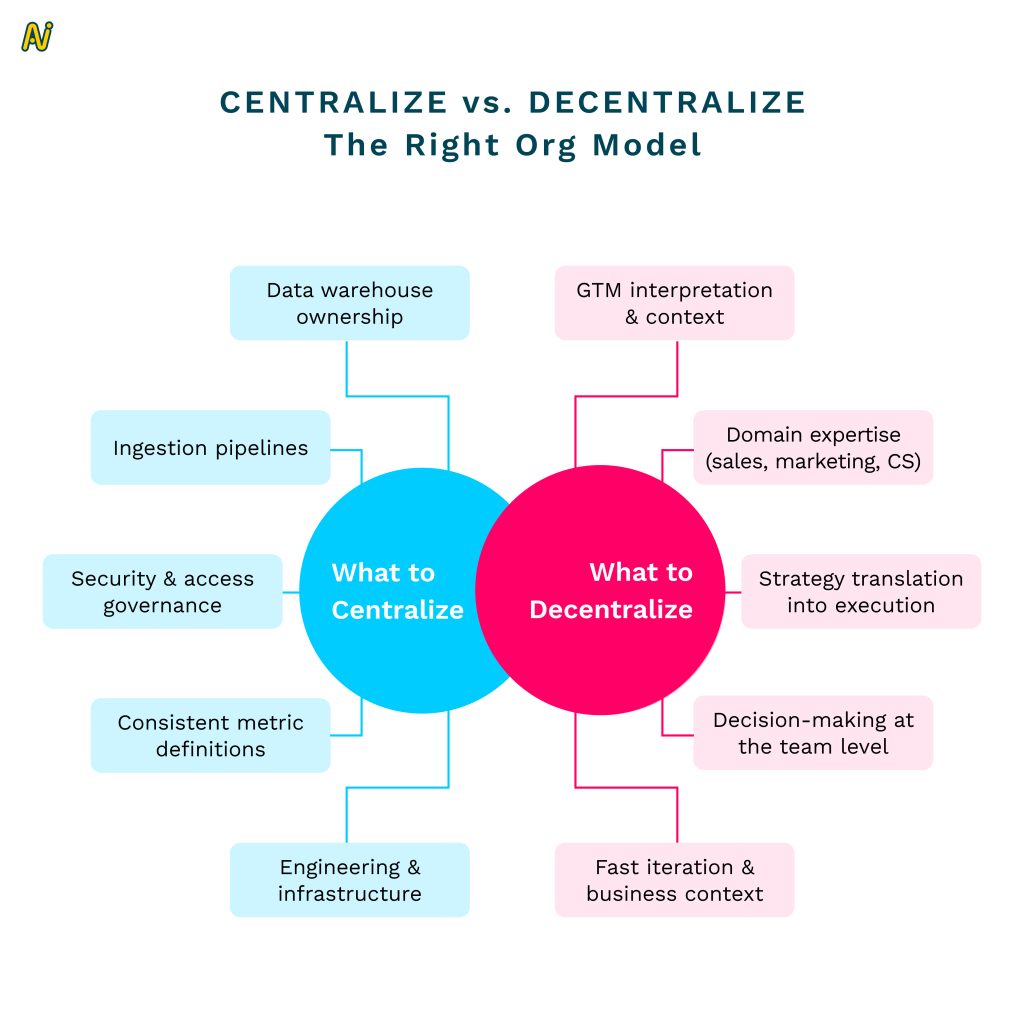
  • Centralize standards, decentralize expertise: data teams should enforce consistency, but business teams must own meaning.
  • Self-serve analytics must be governed: access without role-based security creates risk, not leverage.
  • Shared incentives beat functional optimization: misaligned comp structures destroy GTM experiments.
  • AI needs two pillars: data hygiene and a semantic layer with documented definitions.
  • Changing behavior is harder than fixing data: scripts can clean anomalies. Only incentives can clean habits.
  • Small AI pilots win funding: start with one constrained workflow, prove value, then scale.
  • Revenue intelligence is not about more dashboards. It’s about better decisions.

Clean Dashboards Don’t Guarantee Clean Revenue

Most GTM issues don’t start in analytics.

They start earlier:

  • Duplicate accounts
  • Broken CRM ↔ product mapping
  • Manual spreadsheet patches
  • Shifting metric definitions
  • No historical tracking

If those foundations are unstable, everything built on top becomes fragile.
You can operate at 80 percent accuracy for a while. But eventually the blind spots surface.

In a public company, that surface is earnings. In a private company, it’s hiring plans, spend allocation, and missed forecasts.
And by the time leadership notices, the root cause is buried under months of accumulated noise.

The Hidden Breakpoint: Definitions and Snapshots

Even clean raw data is not enough.
  • Definitions drift.
  • Pipeline changes meaning.
  • Attribution logic evolves.
  • Activation criteria shift.

“Despite having clean data, if your definitions continue to fluctuate and you don’t have versioning, applying it to historicals is not feasible.” — Uday Sharma

Without version control, every quarterly comparison becomes a debate. Without snapshots, you cannot answer the simplest post-mortem question: What did we believe at that time?

Uday’s rule is firm: It’s really important to snapshot every object that is important to you!

  • Opportunities
  • Accounts
  • Stages
  • Amounts
  • Product signals

Snapshotting is not a nice-to-have. It’s your ability to debug reality.

From Reporting to Revenue Driver: The Cloudflare Story

At Cloudflare, Uday’s team built something most RevOps teams aspire to but rarely execute well: an internal analytics product.

It started small.

 – A prototype during COVID.
– Warehouse-backed queries.
– A custom interface for sellers.

Within months, it was rolled out across the company. And immediately shut down!

“It was too risky to have all this information at the fingertips of every employee,” Uday recalls.

“It was too risky to have all this information at the fingertips of every employee.” — Uday Sharma

That moment changed everything. Instead of retreating, the team rebuilt with:

  • Role-based access
  • Customer-level security rules
  • Aggregated views only
  • Strict governance

They relaunched. Adoption surged.

  • 500+ daily active users.
  • Used live in customer calls.
  • Attribution north of $100M per quarter.

The real validation?

“We would walk in to the sales floor and see our product lit up on their screens.” — Uday Sharma

Revenue intelligence became operational leverage.

Centralized Data vs Embedded Analytics

Where should analytics live?

At Cloudflare, it sat within Finance. At Postman, Uday operates between the central data team and revenue leadership.

His stance is nuanced.

Central teams provide:

  • Standardization
  • Security
  • Pipeline reliability
  • Platform consistency

Embedded teams provide:

  • Context
  • Business alignment
  • Speed
  • Strategic influence

The centralized team can become the gatekeeper. Also, fully decentralizing creates chaos.

His rule:

“Centralize where you need consistency. Decentralize where you need subject matter expertise.” — Uday Sharma

Structure should accelerate clarity, not politics.

Everything Should Be Measured. Few Things Should Be Monitored.

Modern GTM teams measure everything. But measurement without prioritization creates noise.

Signal filtering is a leadership skill. He highlights one metric that exposes truth quickly: Dollar-Based Net Retention.

“Great companies have it north of 130 to 140 percent.” — Uday Sharma

If you’re hovering near 100 percent, you don’t have a reporting problem. You have a structural problem.

  • Churn.
  • Expansion gaps.
  • Customer misalignment.

DBNR forces alignment because it touches every function.

The Real GTM Failure Point: The Handoff

Most revenue breakdowns don’t happen within teams.
They happen between them.

Marketing → Sales
Sales → Post-Sales

“If marketing only has a goal of creating pipeline, they can pour millions into events and generate MQLs. But are these effective leads?”” — Uday Sharma

Comp plans create behavior. Behavior creates data. Data creates decisions.
And customers experience none of those internal boundaries.

To a customer, it doesn’t matter whether you’re from marketing or post-sales. You’re one product!
Shared incentives beat siloed metrics. Every time!

The Analytics Leader Shift: From Report Factory to Strategy Partner

Dashboards are getting easier to build. AI agents can generate visualizations.

That is not the moat. The real differentiator?

“Context”.

“Producing a report is going to become much easier,You don’t want a factory of people just creating reports without understanding what they mean.” — Uday Sharma

He screens for one thing above all: Can you articulate what the chart means and how it should be used?

Analytics leaders must:

  • Filter noise
  • Frame tradeoffs
  • Influence action

Otherwise, they become slide generators.

AI in GTM: Two Pillars or Don’t Bother

Everyone is deploying AI. Few are ready.

Uday outlines two prerequisites.

1. Data Hygiene

“You can’t really build any intelligent AI system on bad data.” — Uday Sharma

  • Product usage
  • CRM
  • Billing
  • Opportunity objects

If these are inconsistent, AI multiplies confusion.

2. A Semantic Layer with Defined Ontology

Uday emphasizes this repeatedly:

“We need to teach the AI which resource to query.” — Uday Sharma

That requires:

  • Documented definitions
  • Consistent entity mapping
  • Clear business logic

This is not prompt engineering.

It’s architecture. Without structure, AI guesses.
Guessing inside revenue systems is expensive.

Funding Data Work: Think Like a Founder

CFOs fund evidence, not ambition.
Uday’s advice is practical.

“Trying to boil the ocean with an AI agent is not going to succeed.” — Uday Sharma

Instead:

  • Pick a small workflow.
  • Teach an agent one skill.
  • Ship fast.
  • Measure time saved.

Prototypes unlock budget. Vague transformation decks do not.

The Takeaways

Uday Sharma’s playbook is not about dashboards.

It’s about foundations.

  • Versioned definitions
  • Historical snapshots
  • Governed access
  • Shared incentives
  • Clear semantic layers
  • Disciplined experimentation

Modern revenue teams don’t need more metrics. They need metrics they trust.

They don’t need more tools. They need systems that align.

Because when data is wrong, AI does not fix it. It accelerates it.

And acceleration without direction is just faster chaos.

Want to hear more stories from revenue leaders? Subscribe to The Revenue Lounge podcast to never miss an episode!

More Resources

5 Steps to Navigate Buying Groups in 2025: A RevOps Guide

5 Steps to Navigate Buying Groups in 2025: A RevOps Guide RevOps 10 min In today’s business environment, B2B buying is never just one person. According to Forrester Research, more than half of global business buyers purchase in complex buying scenarios that include more people, more departments, and generally higher price points. And this buying group can be made up of 7 to 20 people! Unlocking the power of buying groups is a crucial aspect of the B2B landscape. This blog is a synopsis of our conversation with revenue operations leader, Nandini Karkare. She is currently the SVP of RevOps at Zywave. Nandini suggests strategic steps to navigate through the realms of Revenue Operations and helps uncover the strategies, insights, and best practices that constitute a comprehensive guide to mastering the dynamics of buying groups. Read on to get actionable tips on how you can navigate buying groups in 2025 (and beyond). And implement the learnings to create a winning GTM motion. Here are the 5 steps Nandini recommends: 1. Decode Your Buying Groups The buying groups typically consist of members from departments and they all contribute different aspects. It is critical to understand the scope of decision-making including the people who play the most significant roles in making the call. Gartner’s report on B2B Buying highlights that 77% of B2B purchases involve a buying group of four or more people. PS: The key stakeholder can turn out someone altogether different from who you had building a relationship with all along. a. Capturing Buying Group Members   Effective buying group management means considering not just decision-makers but influential stakeholders across departments. Misidentifying key players or focusing solely on the main contact risks derailing the sale. (i) How can you map the entire buying group efficiently? Leverage internal and external data to identify the key players Segment the Group by Role and Influence (ii) Not everyone in the buying group holds equal power or influence. Segment them into categories: Decision-makers (who give the final heads-up) Influencers (who sway the decision) Users (who use the product and provide feedback) Budget owners b. The Role Transition Within a Buying Group   Moving the focus from a buying group to a renewal or expansion committee includes knowing precisely who remains in the relationship, as well as who becomes more active as an account grows. (i) New roles may emerge in a Buying Group Technical or operational leaders may become more influential post sale, since they are now using the product. (ii) The focus shifts from buying to renewal The interaction should be more about the return on investment (ROI) of the product placed on the market, ongoing value delivery, and ongoing needs. (iii) Alignment between the buying groups and renewal committee Leveraging the same enthusiasm and relationships generated at the first-buying stage helps in anchoring the transitions and preventing any drop-offs in engagement. Related Resource: Navigate Enterprise Buying Committees: Strategies for Driving Alignment c. Understand the Personal and Collective Priorities of a Buying Group As per McKinsey & Company, B2B buying decisions increasingly require engagement across departments, with 60% of purchasing committees including members from outside traditional procurement, like IT and HR. (i)Alignment Between C-Suite and Technical Teams Decisions aren’t Made in a Vacuum Collaboration between C-suite and technical teams ensures a holistic approach to solving customer problems, creating stronger, more sustainable relationships Their cross departmental collaboration can help with: (ii) Alignment on Strategic Goals C suite executives need technical assistance to translate their strategic vision to reality that also aligns with company-wide objectives. (iii) Technical Validation These insights guide the C-suite in making informed decisions that fit technical infrastructure and future-proofing. (iv) Cross-functional Communication Bridging the gap between these two groups involves continuous, open communication, ensuring that technical evaluations don’t delay business goals but instead support them cohesively.   iii. Understand the Product Take product demos, listen to sales calls, and use tools that show how the product is sold. This helps in understanding the customer needs better. iv. Dive into Your CRM Understand your CRM (whether Salesforce or HubSpot) to assess how the data is organized. This is to check whether it’s easy to use, and identify immediate improvements. The CRM should be the central source of truth, with other tools supporting it. The data should be unified with easier adoption for the teams. v. Build Trust Internally Establish trust within your teams by listening carefully, asking questions about how RevOps can help, and addressing quick fixes to show you’re there to help. Having this trust shows them that you’re here to support their success. Quick wins, such as small fixes that make people’s jobs easier, helps in establishing credibility early. 2. Establish Clear KPIs   i. Understanding Team KPIs It is important to ask you stakeholders about the KPIs that matter to understand their goals and what their expectations are. ii. Aligning KPIs Across Teams Different departments oftentimes work in silos. RevOps should strive to align these departments and check if these KPIs match the overall business objectives. Gaps must be closed if their KPIs don’t align. iii. Setting RevOps KPIs As you approach the end of the first 30 days, start establishing RevOps-specific KPIs that match company goals, which may involve metrics like revenue increase, conversion rates, or improvements in overall efficiency. 3. Tech Stack Audit Deep dive into the existing tools that your company is using. Identify all redundancies, and find opportunities to streamline the entire tech stack. i. Map Out Tools Compile a list of all tools used by teams, noting their purpose and how they work with the CRM. ii. Evaluate Use and Cost Determine if tools are actively used or if there are duplicates. Look for cost-saving opportunities by consolidating tools when possible. https://www.youtube.com/watch?v=sVDJ9KI1tGw&t=869s Next 30 days – Alignment and Control The next 30 days marks a shift from discovery to alignment. The goals should be to create cohesion between departments (e.g., Sales, Marketing) and laying down effective controls. The improvements need to be implemented without overwhelming the teams. This phase combines

Everything You Need to Know About Sales Territory Mapping

Everything You Need to Know About Sales Territory Mapping RevOps 10 min Successful sales strategies play a key role in achieving business goals. But what drives these strategies from inception to execution, improving sales operations and on-ground performance? Sales territory mapping.  Without the right sales territory map template, your sales team could face challenges, namely: Poor productivity Revenue mismatch or imbalance Subpar revenue performance  Poor customer experience Leading to the loss of clients, and Waste of valuable resources  So, how do you get sales territory mapping right to achieve business goals and grow your revenue? Let’s find out in this blog. Sales Territory Mapping: Setting On-Ground Sales in Motion Sales territory mapping defines and visualizes the area, sales amount, and revenue your sales team will target. It divides and categorizes customers based on specific characteristics within your ideal customer profile (ICP). A sales territory map template also helps you assign categories and customers to the salespersons best equipped to serve them.  It lets you reach the right customers in the right areas with the right characteristics to achieve targets and improve growth.  The task of aligning your sales plan with business goals in the most profitable way lies with sales managers.  From the larger business perspective, sales territory mapping is part of location intelligence. Today, location intelligence helps segment customers and find more relevant target markets for revenue success.  How Is Sales Territory Mapping Instrumental to Business Growth? A sales territory map template does more than act as a blueprint. Here are 6 more ways in which it contributes to growth.  1. Ties Back to Business Goals Sales territory mapping creates a blueprint for achieving your business goals. It clearly lays out sales targets and directs reps to the most profitable customers or verticals by strategically assigning territories. 2. Maintains Balance One of sales territory mapping’s primary objectives is to secure a balanced and fair distribution of work among sales teams. It moves and optimizes resources effectively to maximize revenue potential.  3. Increases Selling Time Reps can increase facetime with clients by cutting down time spent on planning. This is specifically made possible with sales territory mapping tools that decrease planning time from months to minutes.  4. Improves Win Rates Naturally, when reps spend more time selling, they can nurture clients better through the sales funnel. Moreover, each assignment is backed by data. This data offers more visibility into customers and prevents deals from slipping through the cracks.  As a result, reps can improve customer experience and uncover new leads to increase win rates.  5. Boosts Morale A sales territory map template encourages intelligent planning, further improving sales productivity. Additionally, when reps can increase win rates, achieve their quota, and earn more, it boosts their morale. And if reps are happy, it means your attrition rates are lower.  It’s not just that. A sales territory map template also highlights improvement areas useful for coaching.  6. Extracts Hidden Insights Sales territory mapping helps measure sales data by connecting the map to the CRM. Therefore, when multiple salespersons are involved in a deal, you can attribute the sale to the right person.  Recognizing the benefits of sales territory mapping is the first step in setting up your own template. Step two is understanding its different types.  Choosing From 5 Types of Sales Territory Mapping Conventionally, sales territories were based on locations. However, you can customize them today as per your customer, market, or even product needs.  Let’s take a look at the 5 types below.  1. Geography Geographic sales territory mapping is the most commonly used and also the oldest. It classifies your market based on, you guessed it, geographical locations—cities, states, countries, and zip codes.  For example, Sales Team A can serve Texas, while Sales Team B covers California.  To get geographic mapping right, your sales team must have a regional, cultural, and linguistic understanding of the territory they’re allocated.  It’s also important to ensure that the selected sales team is available when customers are active in the designated regions.  2. Product Product-based sales territory mapping can be used when you have multiple offerings. You can categorize and assign reps to specific products or technological offerings.  This method is useful when certain reps have in-depth expertise on specific products. For example, Team A has expertise in CRM solutions and is assigned to this offering, while Team B caters to clients looking for Digital Advertising software.   Assigning your reps to the right products will ensure they can sell to clients more convincingly.  3. Customer  The third way to divide your sales territories is based on specific customer characteristics like demographics or roles.  For instance, Sales Team A may sell to clients with a yearly revenue of $500,000. On the other hand, Sales Team B focuses on the higher margin clients with yearly revenue of $1 million and upwards.  4. Industry  Industry-based sales territory mapping assigns reps to specific industries or verticals.  It works best when your product caters to individuals or businesses from multiple industries.  For example, Team A sells to the construction industry, while Team B covers the education sector. Similarly, Team A could be selling to the education industry overall, while Team B handles specific verticals–like universities or higher education–and Team C is responsible for schools.  5. Sales Channel An upcoming type of sales territory map template categorizes territories per the sales channels your reps or clients use.  That’s because buyers now use ten or more channels, on average, as they move through the buying process. They use a combination of digital self-serve channels for certain activities and videos or in-person channels for others.  Consider this example. Team A is responsible for selling via digital channels like social media, and Team B sells through offline channels such as cold calling.  You may also get more granular by assigning reps with expertise in certain platforms to those mediums. For instance, Rep A sells via emails, and Rep B may use LinkedIn.  Knowing the key types of sales territories is awesome. But figuring out the type of

Scroll to Top

Just one more step