

Aligning AI Initiatives With Business Goals

Aligning AI Initiatives with Business Goals

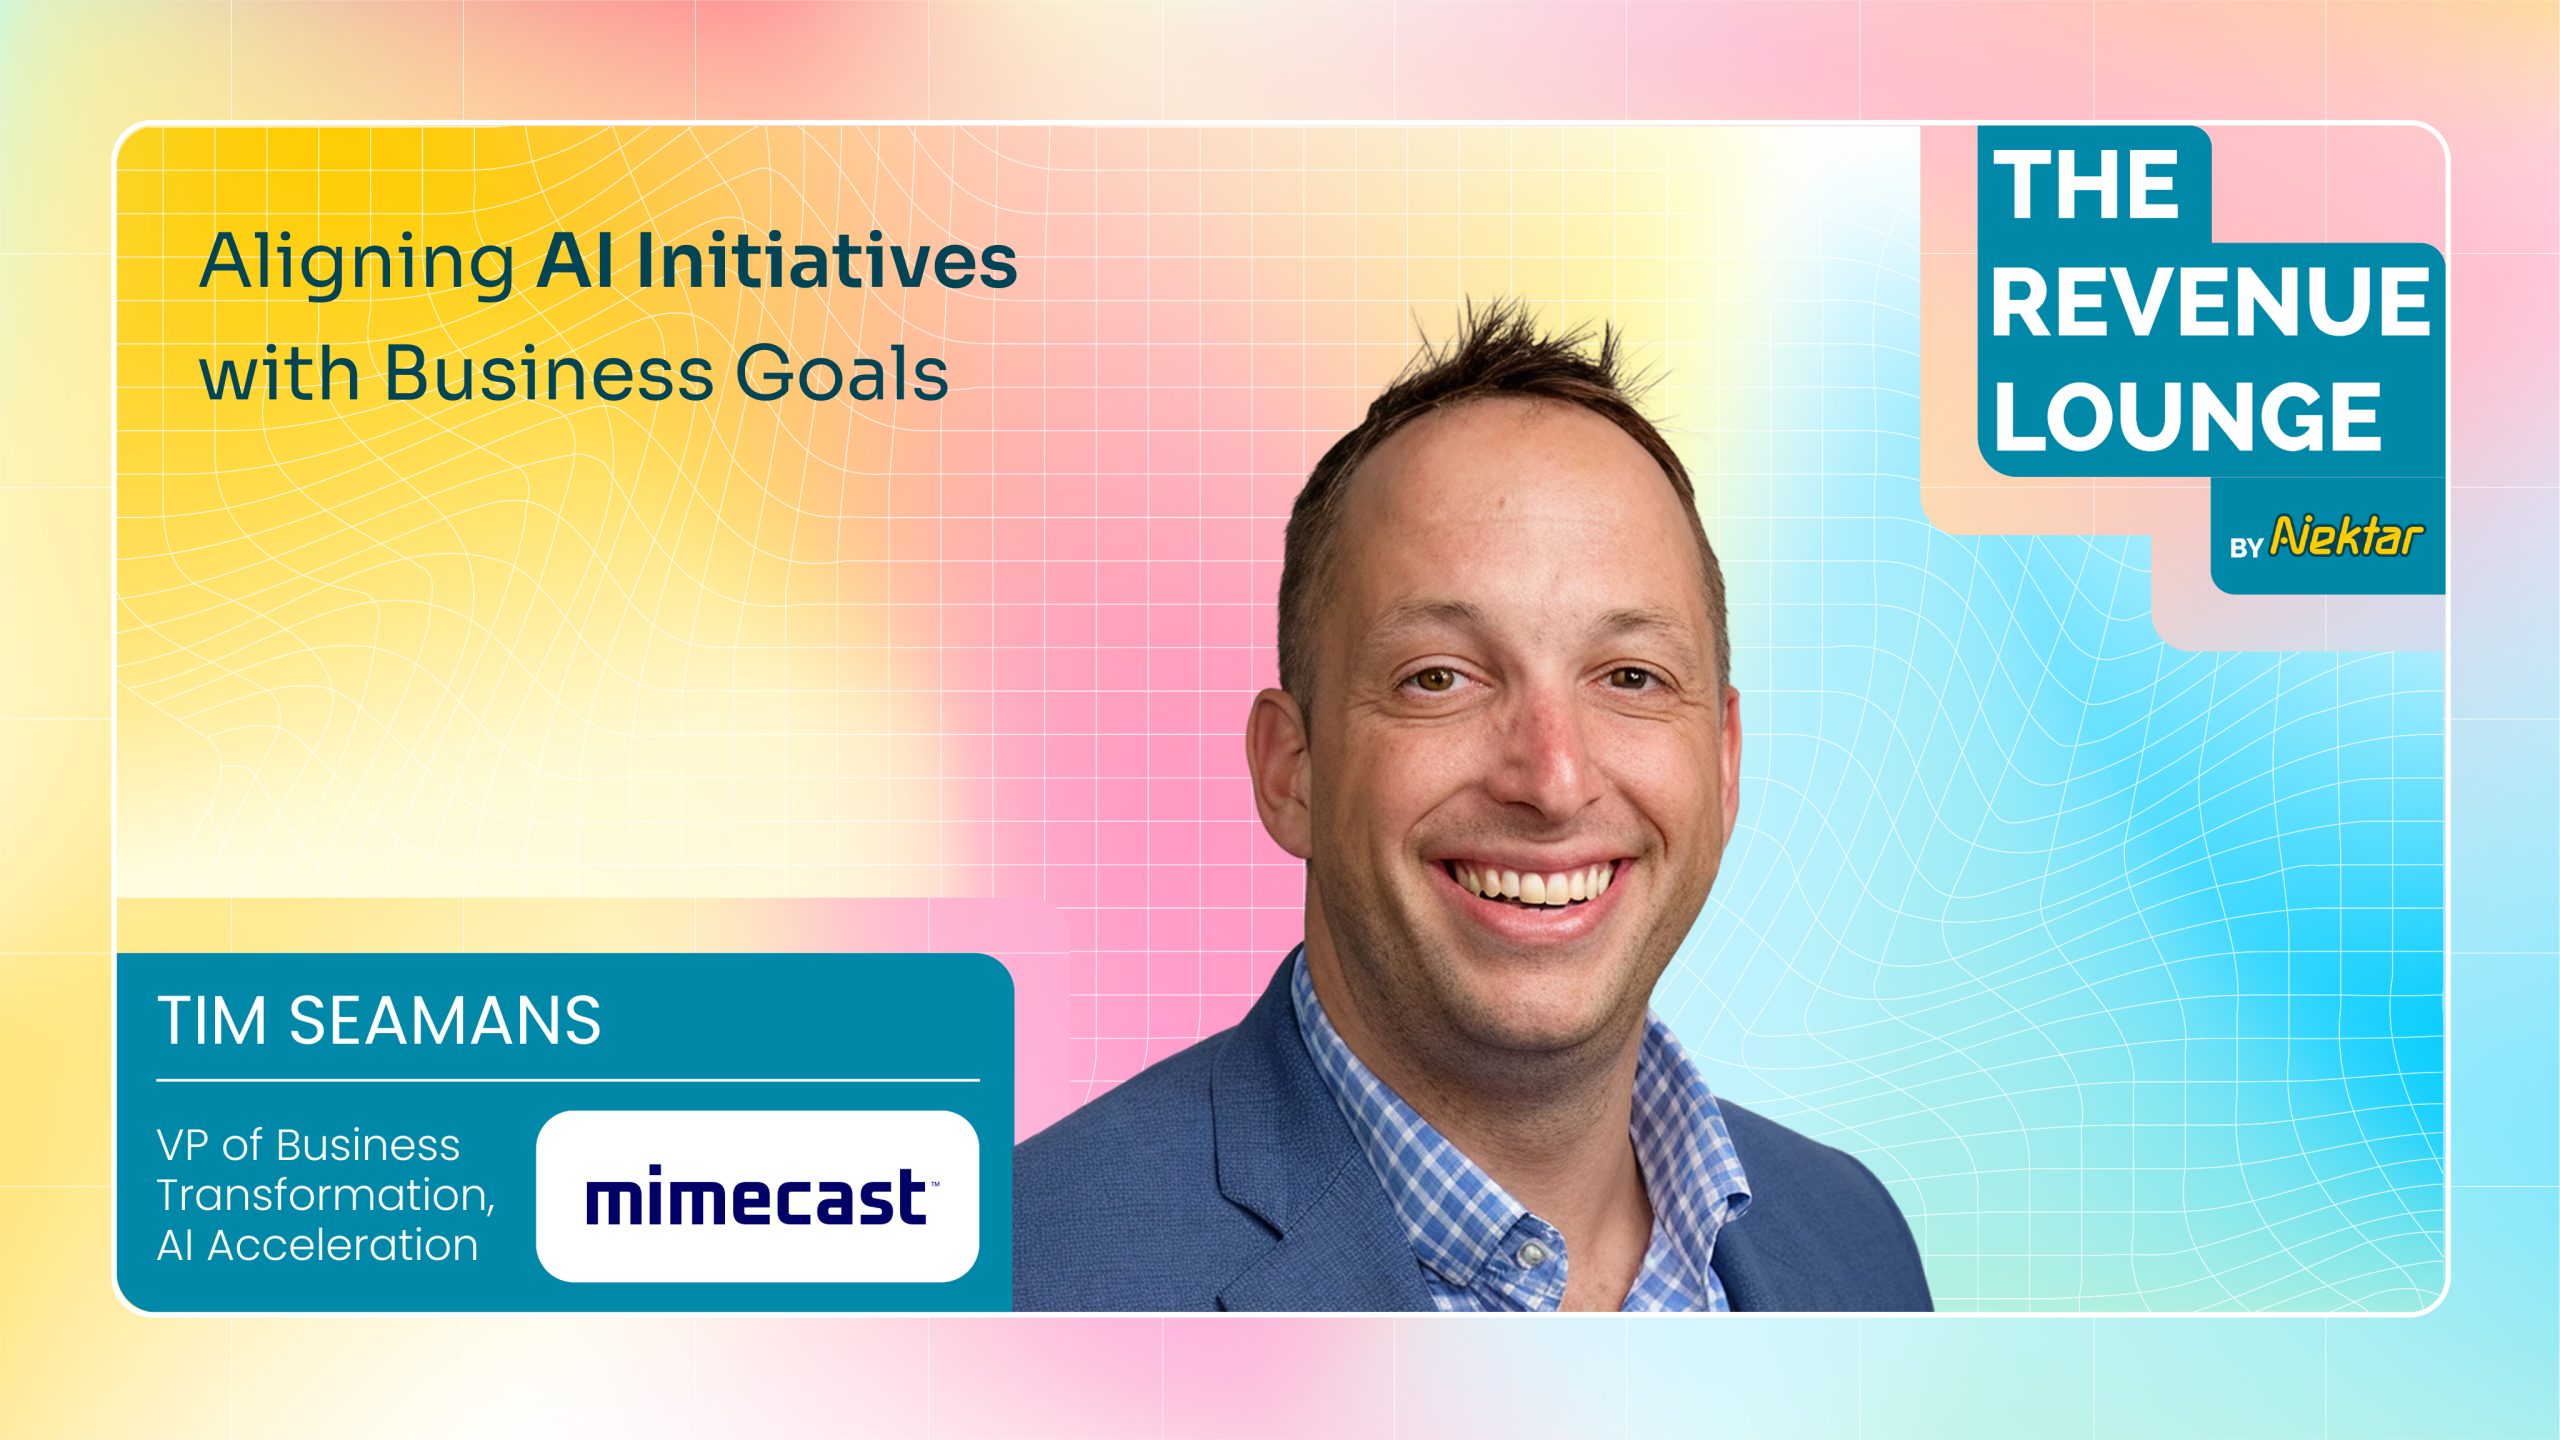
A conversation with Tim Seamans, VP of Business Transformation, AI Acceleration at Mimecast.

ai transformation

Executive summary

Mimecast’s AI transformation program is not a pilot. It is a company-wide operating system shift run by a small central team reporting to the Chief Digital Officer, with board-level sponsorship and clear commercial targets. In the first 80 days of a major go-to-market initiative, the team directly attributed 2 million dollars in expansion revenue and 30 million dollars plus in pipeline by consolidating signals, standardizing processes, and pairing predictive models with generative tools at the point of action.

Today, every department uses generative AI and more than 60 percent of employees hold a gen-AI certification, supported by a structured AI fluency program embedded into new-hire induction. The program measures outcomes across acquisition, expansion, retention, and productivity, with security and governance built in from the first pilot.

Below is the complete playbook from Tim Seamans, VP of AI Transformation at Mimecast, on how to design the charter, win stakeholder alignment, fix data, implement governance, measure results, and step toward agentic AI.

The Mandate and Where the Function Sits

Mimecast placed AI Transformation under the Chief Digital Officer who also oversees IT. That created proximity to platforms and data, without burying the team as a pure infrastructure group. The model works because the mandate is explicit and backed by the CEO and the board.

Charter in one line

  1. Embed AI in how the company works to improve productivity and efficiency.

  2. Govern AI across product, operations, and customer interactions.

  3. Build proprietary AI capabilities for durable advantage, not just tool parity.


“We went from something we might do if we had the right expertise to something we have to do. We are driving our business using AI.” — Tim Seamans

The Team: Small, Specialized & Outcome Focused

We asked Tim about how his team is currently structured. Here’s his breakdown:

Core capabilities:

  • Engineering and Architecture. Owns build vs buy, data and model architecture for scale.

  • Data Science. Four specialists across predictive modeling and generative techniques.

  • Program Management. Orchestrates cross-functional delivery and partner ecosystem.

  • AI Fluency. Strategy owned by the transformation team, executed with Enablement and L&D.

AI Fluency as a Business Capability

Mimecast made fluency non-optional. A three-level program powers adoption and safe use.

  • Level 1: Foundations for everyone. What AI is, how to use it safely, and where it fits in your job. Delivered in new-hire induction with a short certification.

  • Level 2: Builders. Power users who design task assistants and simple workflows.

  • Level 3: Data scientists and advanced builders. Rolled out after Levels 1 and 2 saturate.


“People using AI will replace your relevance. The bus is already moving. Get on it or get left behind.” — Tim Seamans

Adoption funnel:


Applicants to Level 1 → Certified users → Level 2 builders → Team-embedded champions → Program mentors

How GTM Value Was Created and Measured

The GTM program combined machine learning signals with generative tools at the moment of action. The team unified disparate workflows around outcomes, not around a single mega-platform migration.

Case snapshot: Expansion motion

  • What changed: Signals from CRM, product usage, and recent acquisitions were unified into a single expansion workflow that suggested what to sell, to whom, and why.

  • How it worked: Predictive propensity + recommended offers + gen-AI for messaging and objection handling.

  • Outcomes in 80 days: $2M in directly attributed expansion, $30M plus in pipeline.


“We brought everything together based on outcomes. Signals, the right opportunities, and gen-AI assistance for the conversations.” — Tim Seamans

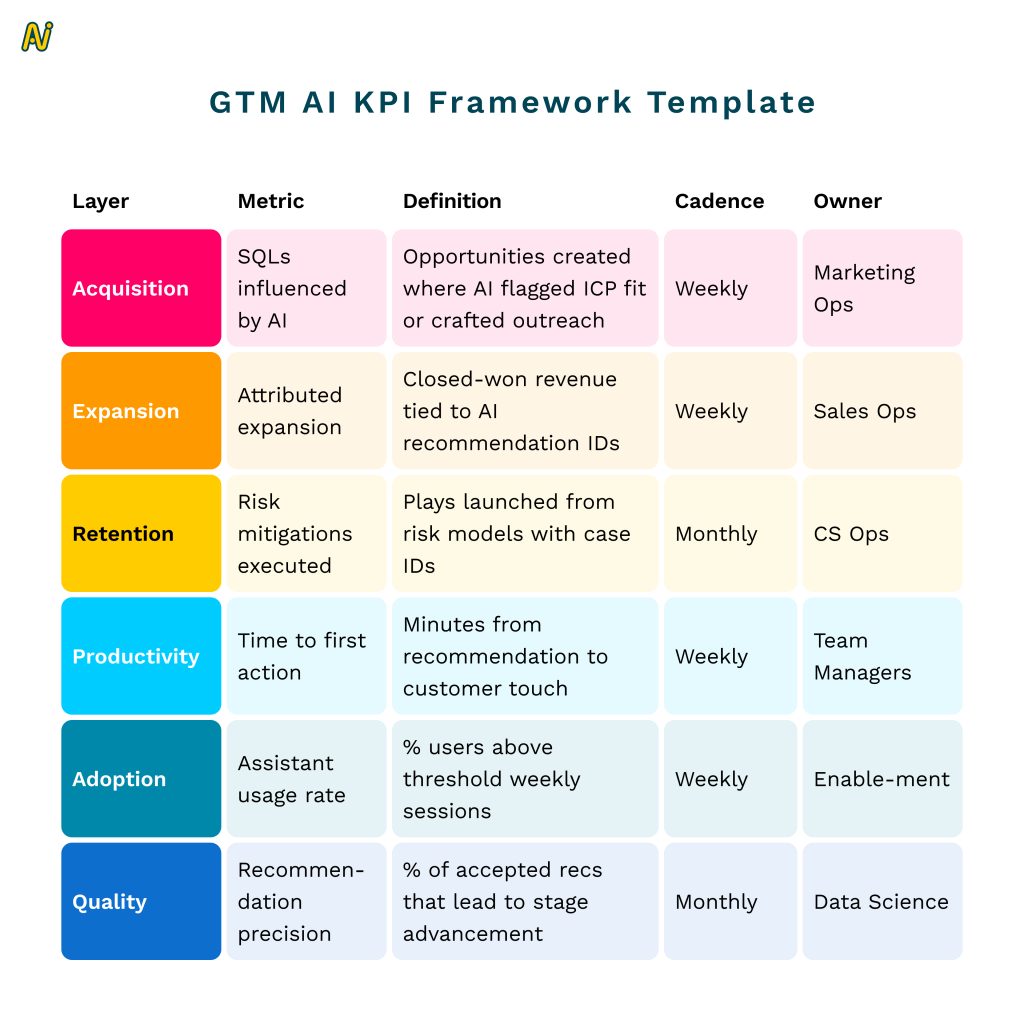
What is actually measured:

  • Top line: New logo acquisition, expansion rate and mix, retention and churn avoidance.

  • Productivity: Hours saved translated to dollars only when tied to a business outcome.

  • Adoption: Assistant usage, recommendation acceptance, win-rate deltas, time-to-first-action.

  • Leading vs lagging: Recommendation acceptance and assistant usage are leading indicators. Retention is lagging and requires patience.
ai transformation


Stakeholder Alignment: Start with Goals, Not Tools

The team begins every engagement with a simple sequence:

Goal → Pain → Option.

  1. Ask business leaders to state their goals in commercial terms.

  2. Map pain points that block those goals.

  3. Decide build vs buy and define a thin slice to prove value.


“If you start with technology, you will likely have a longer road. Take a thin slice, prove value, then scale with champions.” — Tim Seamans

Checklist: Thin-slice pilot readiness

  • Specific goal with a numeric success threshold

  • Data access path documented

  • Process owners signed up to change work patterns

  • Governance controls defined before any user touches the tool

  • Instrumentation for adoption and outcome attribution

Data Strategy: Fix Availability, Standardize, Then Expose

The biggest friction is not algorithms. It is data availability, fragmentation, and security constraints, especially after acquisitions and product evolution.

What Mimecast did:

  • Standardized core entities and created data that did not exist where needed

  • Built secure pipelines into the CRM for contact and buying committee context

  • Used a governed data store as the truth source for customer and prospect insights

  • Accepted that some product feature telemetry still needs work and built a plan to fill gaps

Governance & Security: Parallel to Innovation, Not After It

Compliance, legal, security, and procurement are in the room from day one. The goal is to move fast with minimum viable governance, then scale safely.

Governance controls in practice

  • Approved tool list with monitoring for shadow AI

  • Instructional guardrails for assistants and agents

  • Red-teaming and hallucination checks before scale

  • RACI for policy updates when assistants cannot answer

  • Vendor review criteria built for gen-AI risks

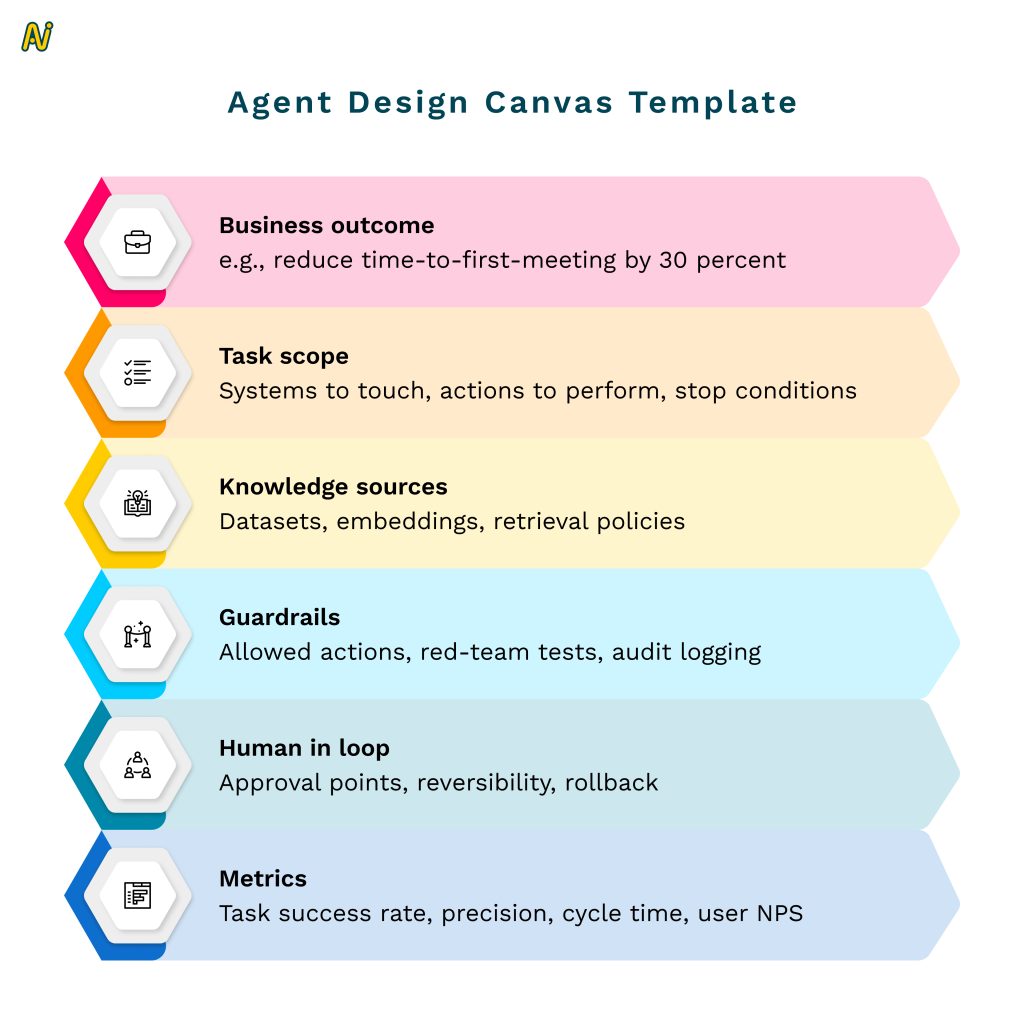
AI Agents: From Task Assistants to True Agentic Coworkers

Internally, assistants handle repetitive tasks with a human in the loop. The next horizon is fully agentic systems that complete actions across tools with verified outcomes.


“Think of true AI coworkers that collaborate across every function. The integration and security layers are the hard part, not the models.” — Tim Seamans

Agent taxonomy:

  • FAQ assistants. High-confidence answers for policies, routed to humans when unknown.

  • Workbench copilots. Research, summarization, draft generation with source grounding.

  • Decision aides. Rank opportunities, propose offers, suggest next best action.

  • Action agents. Execute steps across systems, propose changes for approval, log evidence.
Build vs Buy: A Portfolio View

Mimecast builds where proprietary advantage matters, and buys where the goal is speed and enablement. The decision hinges on data gravity, differentiation, and control.

Decision Matrix:

  • Build if: high differentiation, sensitive data flows, need custom workflows, long shelf life

  • Buy if: commodity capability, low switching cost, tight vendor security posture, short time to value

Finance Partnership & How to Talk About Value

Finance is involved from scoping to post-mortem. The team converts time savings into commercial impact only when tied to outcomes, and sets expectations on lagging measures like retention.


“Do not lead with cost cuts. Focus on top line levers and productivity. Cost will follow on a realistic transition curve.” — Tim Seamans

CFO One-Pager for Each AI Initiative Template:

  • Business goal and baseline

  • Expected lift with confidence ranges

  • Time to first value and dependencies

  • Opex and capex profile, including model and infra costs

  • Adoption plan and training load

  • Measurement plan with leading and lagging indicators

Lessons Learned

  • Start with business problems. Translate to a thin slice that can show value quickly.

  • Invest early in culture and fluency. Adoption follows understanding and safety.

  • Instrument everything. You cannot prove value without usage, acceptance, and outcome IDs.

  • Bring control partners in early. Governance cannot be bolted on later.

  • Expect data gaps. Document them, create interim features, and keep shipping.

  • Treat assistants like products. Version, monitor, deprecate, and support them.

  • Communicate reality on timelines. Expansion and acquisition show faster. Retention takes time.

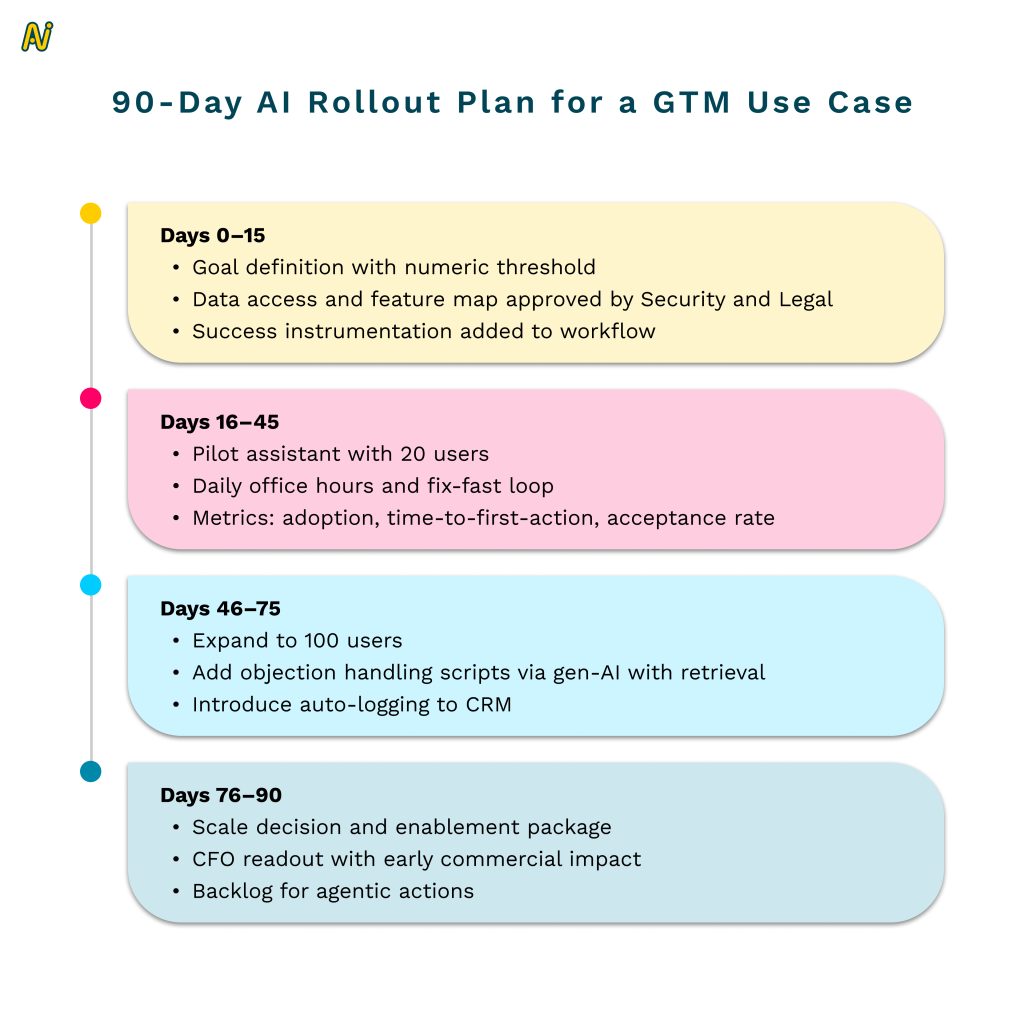
90-Day AI Rollout Plan for a GTM Use Case

Days 0–15

  • Goal definition with numeric threshold

  • Data access and feature map approved by Security and Legal

  • Success instrumentation added to workflow

Days 16–45

  • Pilot assistant with 20 users

  • Daily office hours and fix-fast loop

  • Metrics: adoption, time-to-first-action, acceptance rate

Days 46–75

  • Expand to 100 users

  • Add objection handling scripts via gen-AI with retrieval

  • Introduce auto-logging to CRM

Days 76–90

  • Scale decision and enablement package

  • CFO readout with early commercial impact

  • Backlog for agentic actions

Frequently Misunderstood

Tim debunks some myths and fears surrounding AI and its implementation:

“AI will replace me.”
Not immediately. People fluent in AI will outpace peers. Mimecast solved this with certification and hands-on building.

“The value is time saved.”
Only if time saved converts to a measurable commercial outcome. Usage and acceptance must link to pipeline and revenue.

“We need a single platform.”
You need a single workflow around the outcome. The team unified signals and actions without forcing a monolith migration.

“We can measure retention lift next month.”
Retention is lagging. Set the expectation early and measure the upstream actions now.

A Practical Starting Sequence for Enterprise Leaders

  • Pick one revenue lever. Expansion is usually fastest to show impact.

  • Map the data you have and the data you need. Close only the critical gaps.

  • Ship a usable assistant in weeks that puts guidance where work happens.

  • Instrument adoption and outcome attribution on day one.

  • Train a cohort to Level 1, then Level 2. Reward real usage.

  • Publish a CFO one-pager and review biweekly.

  • Add guardrails as you scale. Prepare for agentic steps with human approvals.

AI Impact at Mimecast

  • 2 million dollars in directly attributed expansion within 80 days.

  • 30 million dollars plus expansion pipeline created in the same period.

  • 95 percent of employees using generative AI in daily work.

  • 60 percent plus certified in generative AI.

  • Small central team with engineering, data science, program management, and fluency.

Want to hear more stories from revenue leaders? Subscribe to The Revenue Lounge podcast to never miss an episode!

More Resources

5 Steps to Navigate Buying Groups in 2025: A RevOps Guide

5 Steps to Navigate Buying Groups in 2025: A RevOps Guide RevOps 10 min In today’s business environment, B2B buying is never just one person. According to Forrester Research, more than half of global business buyers purchase in complex buying scenarios that include more people, more departments, and generally higher price points. And this buying group can be made up of 7 to 20 people! Unlocking the power of buying groups is a crucial aspect of the B2B landscape. This blog is a synopsis of our conversation with revenue operations leader, Nandini Karkare. She is currently the SVP of RevOps at Zywave. Nandini suggests strategic steps to navigate through the realms of Revenue Operations and helps uncover the strategies, insights, and best practices that constitute a comprehensive guide to mastering the dynamics of buying groups. Read on to get actionable tips on how you can navigate buying groups in 2025 (and beyond). And implement the learnings to create a winning GTM motion. Here are the 5 steps Nandini recommends: 1. Decode Your Buying Groups The buying groups typically consist of members from departments and they all contribute different aspects. It is critical to understand the scope of decision-making including the people who play the most significant roles in making the call. Gartner’s report on B2B Buying highlights that 77% of B2B purchases involve a buying group of four or more people. PS: The key stakeholder can turn out someone altogether different from who you had building a relationship with all along. a. Capturing Buying Group Members   Effective buying group management means considering not just decision-makers but influential stakeholders across departments. Misidentifying key players or focusing solely on the main contact risks derailing the sale. (i) How can you map the entire buying group efficiently? Leverage internal and external data to identify the key players Segment the Group by Role and Influence (ii) Not everyone in the buying group holds equal power or influence. Segment them into categories: Decision-makers (who give the final heads-up) Influencers (who sway the decision) Users (who use the product and provide feedback) Budget owners b. The Role Transition Within a Buying Group   Moving the focus from a buying group to a renewal or expansion committee includes knowing precisely who remains in the relationship, as well as who becomes more active as an account grows. (i) New roles may emerge in a Buying Group Technical or operational leaders may become more influential post sale, since they are now using the product. (ii) The focus shifts from buying to renewal The interaction should be more about the return on investment (ROI) of the product placed on the market, ongoing value delivery, and ongoing needs. (iii) Alignment between the buying groups and renewal committee Leveraging the same enthusiasm and relationships generated at the first-buying stage helps in anchoring the transitions and preventing any drop-offs in engagement. Related Resource: Navigate Enterprise Buying Committees: Strategies for Driving Alignment c. Understand the Personal and Collective Priorities of a Buying Group As per McKinsey & Company, B2B buying decisions increasingly require engagement across departments, with 60% of purchasing committees including members from outside traditional procurement, like IT and HR. (i)Alignment Between C-Suite and Technical Teams Decisions aren’t Made in a Vacuum Collaboration between C-suite and technical teams ensures a holistic approach to solving customer problems, creating stronger, more sustainable relationships Their cross departmental collaboration can help with: (ii) Alignment on Strategic Goals C suite executives need technical assistance to translate their strategic vision to reality that also aligns with company-wide objectives. (iii) Technical Validation These insights guide the C-suite in making informed decisions that fit technical infrastructure and future-proofing. (iv) Cross-functional Communication Bridging the gap between these two groups involves continuous, open communication, ensuring that technical evaluations don’t delay business goals but instead support them cohesively.   iii. Understand the Product Take product demos, listen to sales calls, and use tools that show how the product is sold. This helps in understanding the customer needs better. iv. Dive into Your CRM Understand your CRM (whether Salesforce or HubSpot) to assess how the data is organized. This is to check whether it’s easy to use, and identify immediate improvements. The CRM should be the central source of truth, with other tools supporting it. The data should be unified with easier adoption for the teams. v. Build Trust Internally Establish trust within your teams by listening carefully, asking questions about how RevOps can help, and addressing quick fixes to show you’re there to help. Having this trust shows them that you’re here to support their success. Quick wins, such as small fixes that make people’s jobs easier, helps in establishing credibility early. 2. Establish Clear KPIs   i. Understanding Team KPIs It is important to ask you stakeholders about the KPIs that matter to understand their goals and what their expectations are. ii. Aligning KPIs Across Teams Different departments oftentimes work in silos. RevOps should strive to align these departments and check if these KPIs match the overall business objectives. Gaps must be closed if their KPIs don’t align. iii. Setting RevOps KPIs As you approach the end of the first 30 days, start establishing RevOps-specific KPIs that match company goals, which may involve metrics like revenue increase, conversion rates, or improvements in overall efficiency. 3. Tech Stack Audit Deep dive into the existing tools that your company is using. Identify all redundancies, and find opportunities to streamline the entire tech stack. i. Map Out Tools Compile a list of all tools used by teams, noting their purpose and how they work with the CRM. ii. Evaluate Use and Cost Determine if tools are actively used or if there are duplicates. Look for cost-saving opportunities by consolidating tools when possible. https://www.youtube.com/watch?v=sVDJ9KI1tGw&t=869s Next 30 days – Alignment and Control The next 30 days marks a shift from discovery to alignment. The goals should be to create cohesion between departments (e.g., Sales, Marketing) and laying down effective controls. The improvements need to be implemented without overwhelming the teams. This phase combines

Everything You Need to Know About Sales Territory Mapping

Everything You Need to Know About Sales Territory Mapping RevOps 10 min Successful sales strategies play a key role in achieving business goals. But what drives these strategies from inception to execution, improving sales operations and on-ground performance? Sales territory mapping.  Without the right sales territory map template, your sales team could face challenges, namely: Poor productivity Revenue mismatch or imbalance Subpar revenue performance  Poor customer experience Leading to the loss of clients, and Waste of valuable resources  So, how do you get sales territory mapping right to achieve business goals and grow your revenue? Let’s find out in this blog. Sales Territory Mapping: Setting On-Ground Sales in Motion Sales territory mapping defines and visualizes the area, sales amount, and revenue your sales team will target. It divides and categorizes customers based on specific characteristics within your ideal customer profile (ICP). A sales territory map template also helps you assign categories and customers to the salespersons best equipped to serve them.  It lets you reach the right customers in the right areas with the right characteristics to achieve targets and improve growth.  The task of aligning your sales plan with business goals in the most profitable way lies with sales managers.  From the larger business perspective, sales territory mapping is part of location intelligence. Today, location intelligence helps segment customers and find more relevant target markets for revenue success.  How Is Sales Territory Mapping Instrumental to Business Growth? A sales territory map template does more than act as a blueprint. Here are 6 more ways in which it contributes to growth.  1. Ties Back to Business Goals Sales territory mapping creates a blueprint for achieving your business goals. It clearly lays out sales targets and directs reps to the most profitable customers or verticals by strategically assigning territories. 2. Maintains Balance One of sales territory mapping’s primary objectives is to secure a balanced and fair distribution of work among sales teams. It moves and optimizes resources effectively to maximize revenue potential.  3. Increases Selling Time Reps can increase facetime with clients by cutting down time spent on planning. This is specifically made possible with sales territory mapping tools that decrease planning time from months to minutes.  4. Improves Win Rates Naturally, when reps spend more time selling, they can nurture clients better through the sales funnel. Moreover, each assignment is backed by data. This data offers more visibility into customers and prevents deals from slipping through the cracks.  As a result, reps can improve customer experience and uncover new leads to increase win rates.  5. Boosts Morale A sales territory map template encourages intelligent planning, further improving sales productivity. Additionally, when reps can increase win rates, achieve their quota, and earn more, it boosts their morale. And if reps are happy, it means your attrition rates are lower.  It’s not just that. A sales territory map template also highlights improvement areas useful for coaching.  6. Extracts Hidden Insights Sales territory mapping helps measure sales data by connecting the map to the CRM. Therefore, when multiple salespersons are involved in a deal, you can attribute the sale to the right person.  Recognizing the benefits of sales territory mapping is the first step in setting up your own template. Step two is understanding its different types.  Choosing From 5 Types of Sales Territory Mapping Conventionally, sales territories were based on locations. However, you can customize them today as per your customer, market, or even product needs.  Let’s take a look at the 5 types below.  1. Geography Geographic sales territory mapping is the most commonly used and also the oldest. It classifies your market based on, you guessed it, geographical locations—cities, states, countries, and zip codes.  For example, Sales Team A can serve Texas, while Sales Team B covers California.  To get geographic mapping right, your sales team must have a regional, cultural, and linguistic understanding of the territory they’re allocated.  It’s also important to ensure that the selected sales team is available when customers are active in the designated regions.  2. Product Product-based sales territory mapping can be used when you have multiple offerings. You can categorize and assign reps to specific products or technological offerings.  This method is useful when certain reps have in-depth expertise on specific products. For example, Team A has expertise in CRM solutions and is assigned to this offering, while Team B caters to clients looking for Digital Advertising software.   Assigning your reps to the right products will ensure they can sell to clients more convincingly.  3. Customer  The third way to divide your sales territories is based on specific customer characteristics like demographics or roles.  For instance, Sales Team A may sell to clients with a yearly revenue of $500,000. On the other hand, Sales Team B focuses on the higher margin clients with yearly revenue of $1 million and upwards.  4. Industry  Industry-based sales territory mapping assigns reps to specific industries or verticals.  It works best when your product caters to individuals or businesses from multiple industries.  For example, Team A sells to the construction industry, while Team B covers the education sector. Similarly, Team A could be selling to the education industry overall, while Team B handles specific verticals–like universities or higher education–and Team C is responsible for schools.  5. Sales Channel An upcoming type of sales territory map template categorizes territories per the sales channels your reps or clients use.  That’s because buyers now use ten or more channels, on average, as they move through the buying process. They use a combination of digital self-serve channels for certain activities and videos or in-person channels for others.  Consider this example. Team A is responsible for selling via digital channels like social media, and Team B sells through offline channels such as cold calling.  You may also get more granular by assigning reps with expertise in certain platforms to those mediums. For instance, Rep A sells via emails, and Rep B may use LinkedIn.  Knowing the key types of sales territories is awesome. But figuring out the type of

Leave a Comment

Your email address will not be published. Required fields are marked *

Scroll to Top

Just one more step