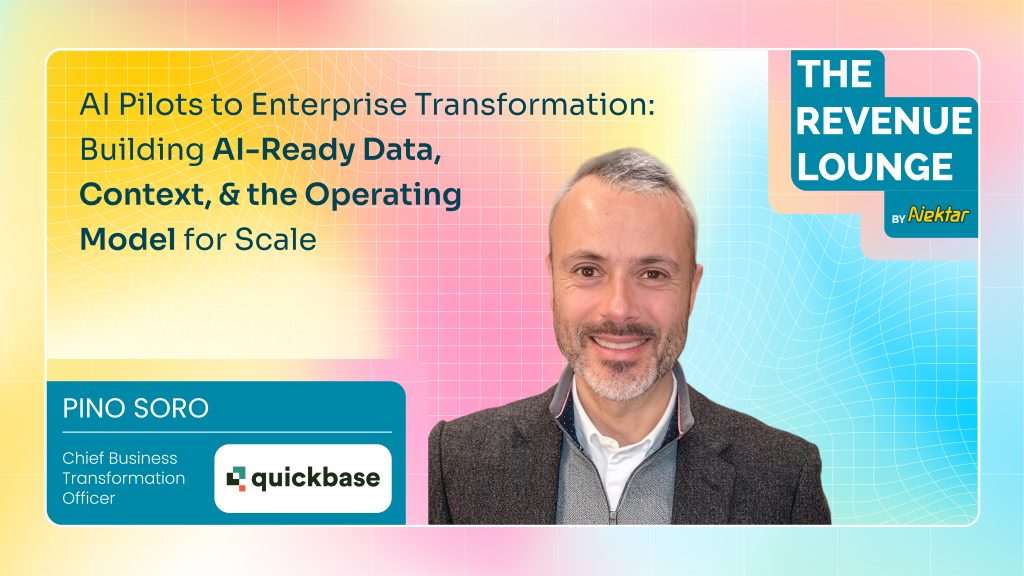
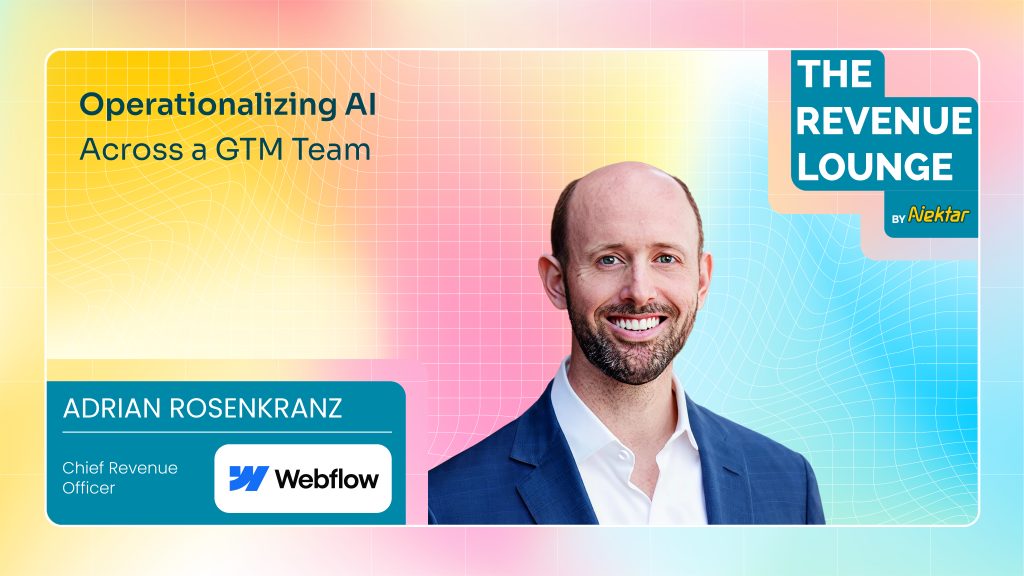
14 RevOps Podcasts Worth Listening to in 2026 Revops 18 min Updated: August 10, 2026 It’s genuinely hard to keep up with everything new in RevOps, and podcasts remain one of the best ways to hear the function’s past, present, and future directly from the people building it. If you want sharper revenue operations and more effective growth strategy, here are 26 shows worth your time, updated for what’s actually still running in 2026. Get our latest insights into your inbox 1. The Revenue Lounge The Revenue Lounge is Nektar.ai’s podcast, hosted by Randy Likas. The show focuses on real-world revenue leadership, interviewing senior RevOps, GTM, and AI leaders to unpack what’s actually happening inside modern enterprise organizations. What you’ll learn: Real field insight into how RevOps actually works inside high-growth companies, straight from the leaders building it, at the intersection of RevOps, AI, data, and go-to-market strategy specifically. Why you should listen: The guest roster speaks for itself, leaders from Carta, Palo Alto Networks, AlphaSense, Miro, Socure, 6sense, Gong, G2, Asana, Nasdaq, ThoughtSpot, and Cohesity have all appeared. With 100+ episodes, 3,000+ subscribers, 5,000+ downloads, and more than a million impressions, it’s become a trusted platform for exactly this conversation. Recommended episode: Aligning AI Initiatives With Business Goals, with Tim Seamans, VP of Business Transformation, AI Acceleration at Mimecast, on how the company unified CRM, product usage, and acquisition signals into a single expansion workflow, attributing $2M in expansion revenue and $30M+ in pipeline within 80 days. Tim’s own framing: “We are driving our business using AI, not a side project run by a small team, but a company-wide operating shift with board-level sponsorship.” Links to listen: nektar.ai/podcasts 2. RevOps Champions Hosted by Brendon Dennewill, CEO and Co-founder of Denamico, a Diamond HubSpot Solutions Partner based in Minneapolis, RevOps Champions targets customer success and RevOps teams leveraging technology to drive alignment across people, process, and tech. What you’ll learn: How to harmonize people, process, and technology in a scaling RevOps function, drawn from conversations with a different RevOps leader each episode. Why you should listen: It’s one of the more consistently active shows in this category, still publishing current episodes as of late 2025, with a format built specifically around practical, technology-forward RevOps advice. Recommended episode: “The RevOps Playbook: Mastering The Three Critical Elements,” with Alison Elworthy, EVP of Revenue Operations at HubSpot, a strong primer on RevOps fundamentals from one of the function’s most recognized practitioners. Links to listen: Apple Podcasts | Homepage 3. The GTMnow Podcast Produced by GTMnow, the media brand of venture fund GTMfund, this show features conversations with tech executives, VCs, and founders who’ve actually built fast-growing software companies, hosted primarily by Scott Barker, with co-host Sophie Buonassisi joining on rotating episodes. What you’ll learn: Unshared, specific detail on what worked and what didn’t in scaling a company’s go-to-market motion, drawn from operators GTMfund’s own network of 350+ GTM executives (from companies including DocuSign, Salesforce, LinkedIn, Snowflake, Okta, and Zoom) actually trusts. Why you should listen: Scott Barker previously ran revenue and partnerships for the original Sales Hacker (acquired by Outreach in 2018), so this show carries forward much of that same practitioner-first spirit under a new name and a VC-backed media operation. Recommended Episode: “GTM 96: The Three Pillars of a Modern Go-To-Market Strategy Every Revenue Leader Should Know,” with Kelly Hopping, covering brand building, customer-centric marketing, and the power of organic search. Links to listen: Apple Podcasts | Substack About the host: Scott Barker is a Partner at GTMfund, where he leads fundraising and runs the firm’s media arm. LinkedIn 4. The RevOps Show Hosted by Doug Davidoff and Jess Cardenas, this show works through the common scenarios, questions, and real problems companies actually face in revenue operations, with a format built around practical process over abstract theory. What you’ll learn: How to integrate sales, marketing, and customer success functions effectively, with a particular focus on turning overwhelming, inefficient reporting into something genuinely actionable. Why you should listen: Doug and Jess’s back-and-forth keeps genuinely dry RevOps subject matter engaging, a real differentiator in a category that can otherwise feel like a lecture. Recommended Episode: “Reporting and Analytics: From Overwhelming and Inefficient to Valuable and Actionable,” on transforming a chaotic reporting process into a streamlined, decision-ready one. Links to listen: Apple Podcasts | Spotify 5. AI to ROI (formerly Metrics That Measure Up) This show has been through a real, multi-step evolution, from “SaaS Talk with the Metrics Brothers” to “Metrics That Measure Up” to its current identity, AI to ROI, hosted throughout by Ray Rike, Founder and CEO of Benchmarkit. The current focus: how enterprises actually translate AI investment into measurable business value, a natural evolution of its original data-and-metrics DNA. What you’ll learn: How senior enterprise leaders are measuring AI ROI in practice, alongside the SaaS metrics and benchmarking content the show built its original reputation on. Why you should listen: Few shows in this category have tracked the industry’s actual shift from “measure your SaaS metrics” to “measure your AI ROI” this directly, making it a useful barometer for how the conversation itself has changed. Recommended Episode: “Measuring the ROI of Transitioning from Outbound to Inbound GTM,” with Aviv Canaani, CRO at Datarails. Links to listen: Apple Podcasts About the host: Ray Rike is Founder and CEO of Benchmarkit, a B2B SaaS benchmarking and metrics platform. 6. GTM Science A show for GTM and RevOps leaders that goes deep on which AI implementations actually drive revenue impact versus which just save time, with a real focus on separating substance from hype. What you’ll learn: The difference between AI that genuinely moves revenue (autonomous SDR agents booking qualified meetings, AI-powered competitive intelligence surfacing opportunities reps would miss manually) and AI that just looks impressive in a demo, plus what has to be true organizationally before AI can actually make an impact. Why you should listen: The show doesn’t shy away from the hard part of the AI conversation, why most